Introduction
Lithium ion batteries consist of a cathode, an anode, a separator and an electrolyte. The function of the electrolyte is to transport positive lithium ions between the cathode and the anode across the separator. Traditional electrolytes consist of lithium salt and organic aprotic solvents. The most commonly used electrolyte is lithium hexafluorophosphate (LiPF6) in a mixture of linear and cyclic carbonates such as ethylene carbonate (EC: C3H4O3 – MM: 88.06 g*mol-1) and diethyl carbonate (DEC: C5H10O3 – MM: 118.13 g*mol-1). The combination of LiPF6 and carbonates is used because of high conductivity and solid electrolyte interface (SEI) forming ability which is necessary to prevent further electrolyte decomposition. It can also ensure continued electrochemical reactions by allowing lithium ion transport to occur while blocking electrons. These types of electrolytes are extremely sensitive to environmental factors, which is why operation of these substances is performed inside a glove box of inert atmosphere.
Chemical Reaction
One of these detrimental factors that affect the stability of the electrolyte is water. Hydrolysis of LiPF6 can occur in quantities at the ppm levels of H2O resulting in the following multistep chemical reaction: LiPF6 + H2O → HF + PF5 + LiOH → LiF + 2HF + POF3.[1] The end products of LiF and HF cause issues in the battery system as LiF is insoluble and an electronically insulating material that increases the thickness of the SEI barrier thereby increasing impedance and loss of capacity; while HF causes the rigid SEI film to become fragile leading to carbonate solvent to diffuse onto the cathode material which in turn releases heat that over time could cause thermal runaway. Thermal degradation of electrolytes has also been reported where solvent decomposition and interactions between lithium salts and solvents can occur at temperatures as low as 70°C. In addition transesterification products can also form from reactions amongst the organic carbonates.[2].
Experimental
In this study, several experiments were conducted via TGA, DSC and evolved gas analysis to investigate the stability of 1.0 M LiPF6 in EC/DEC=50/50 (v/v) acquired from Sigma-Aldrich. Samples were prepared in a glove bag purged with argon utilizing approximately 8 - 10 mg of electrolyte solution pipetted into 40 μL aluminum crucibles that were sealed with aluminum crucible lids that had a laser cut 50 μm pierced hole to allow gases to vent. The electrolyte sample was exposed to varying quantities of time to the ambient atmosphere (N2, O2, H2O, CO2, etc.) prior to testing.
Results and Discussion
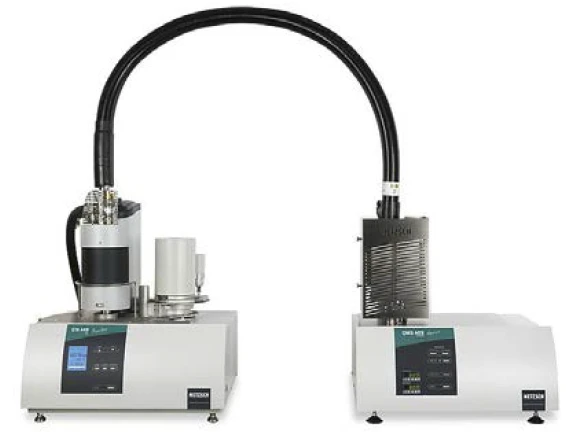
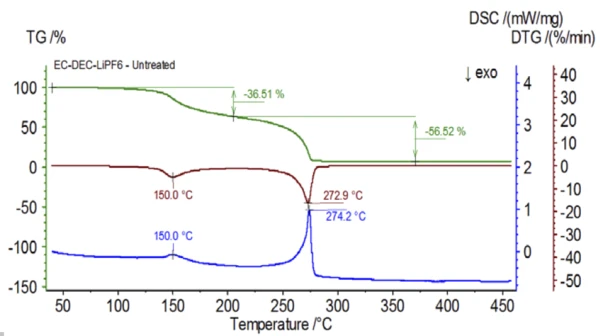
The initial experiment was prepared in the glove bag and immediately loaded into the NETZSCH STA 449 F1 Jupiter® coupled to a QMS 403 Aëolos® (Figure 1) with no exposure to ambient atmosphere in order to acquire the inherent properties of the electrolyte solution. The TGA, DTG and DSC curves of this untreated sample are shown in Figure 2. The sample exhibited two mass-loss steps totaling 93.03% as well as two endothermic peaks. In addition, peaks in the DTG (mass change rate − %/min) were detected at approximately 150°C and 275°C.
The mass spectrum from the NIST library database of ethylene carbonate and diethyl carbonate are shown in Figure 3. Select mass numbers corresponding to diethyl carbonate were traced (45, 59, 63, 75 and 91) as seen in Figure 4 indicating the 1st mass-loss step was likely evaporation of DEC.
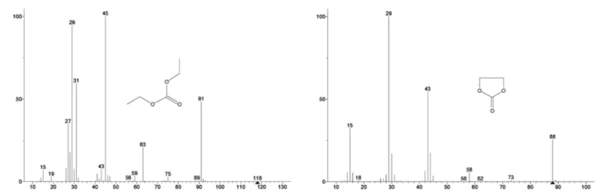
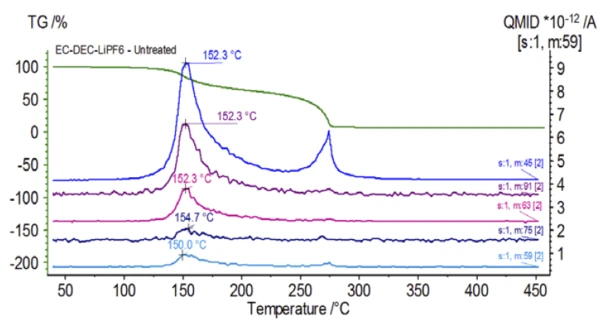
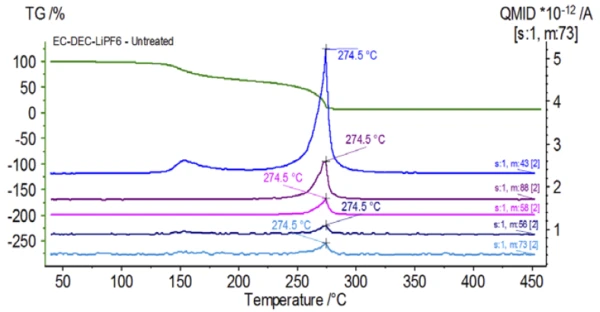
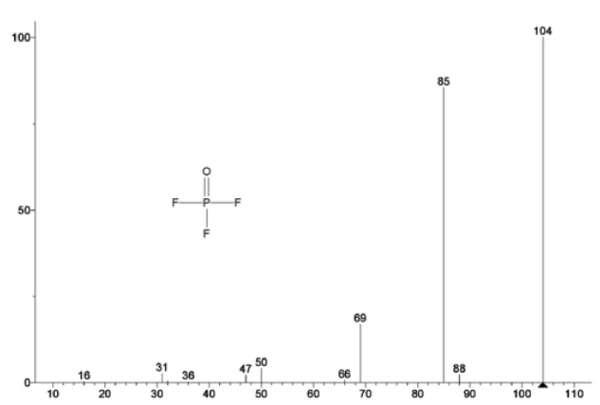
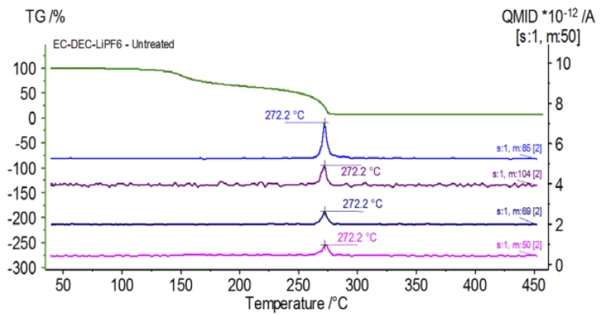
Figure 5 traces mass numbers attributed to ethylene carbonate (43, 56, 58, 73 and 88) indicating likely evaporation of EC during the 2nd mass-loss step. Furthermore, mass numbers 50, 69, 85 and 104 corresponding to POF3 (mass spectrum displayed in Figure 6) also exhibited peaks at 275°C (2nd mass-loss step) shown in Figure 7 indicating likely decomposition of LiPF6.
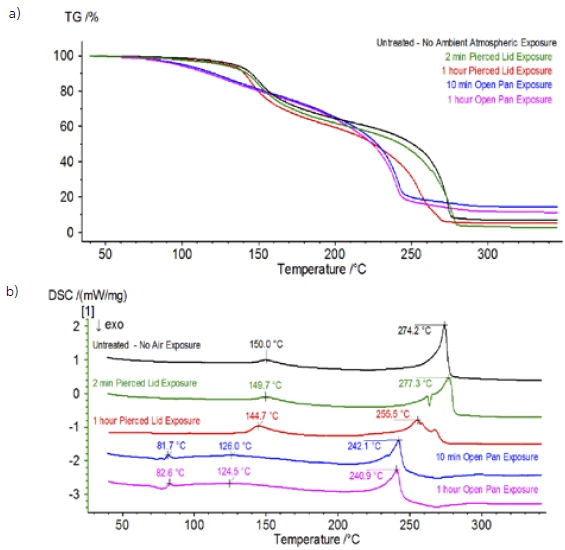
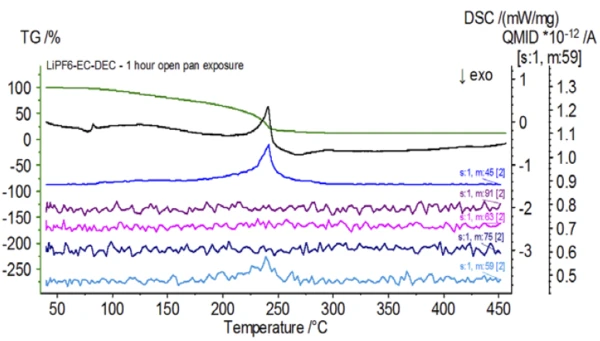
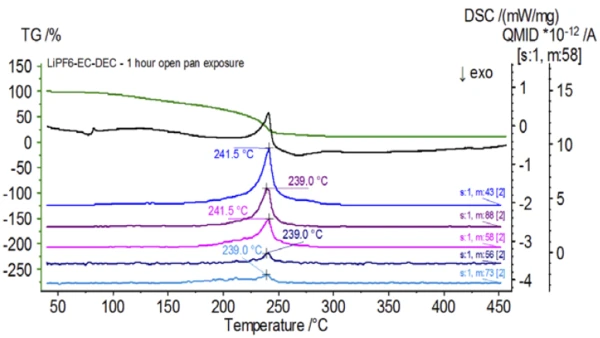
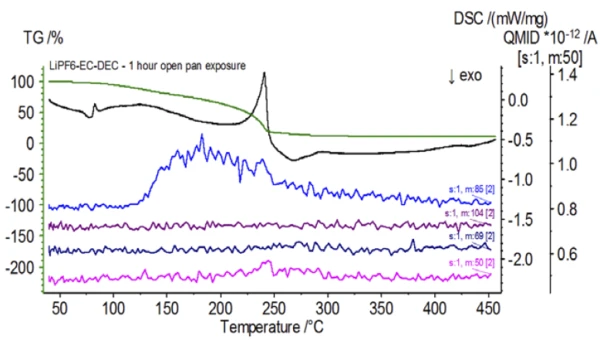
Upon completion of the untreated sample, which was prepared under inert conditions, each successive sample was introduced to varying degrees of ambient atmospheric exposure prior to testing. The first experiment prepared the sample in the inert glove bag with the crucible crimped shut with a pierced lid, but prior to testing the sample was exposed to ambient atmosphere for 2 minutes prior to loading for testing. The second iteration mimicked the first experiment except exposure was 1 hour. For the third experiment, instead of crimping the crucible shut inside the glove bag, the open aluminum pan was removed and fully exposed to the ambient atmosphere for 10 min prior to placing the pierced lid over the crucible and then crimping. The final experiment followed the third experiment’s procedure, but extended the exposure time to 1 hour. The results for all iterations including the untreated sample are shown in Figure 8. For the sample exposed for a period of 2 min with a pierced lid, which is designed to minimize sample volatiles from escaping as well as to limit ambient atmosphere from entering, the TGA and DSC curves show similar profiles with the untreated sample; however there are small, subtle differences such as possible dual endothermic energetics in the DSC curve alongside a slight shift in the 2nd mass-loss step of the TGA curve that might indicate that the test sample was compromised with the brief exposure to ambient atmosphere. With increased duration of atmospheric exposure in the 2nd experiment, the 1 hour sample clearly shows further deviations in the TGA curve and has a more pronounced shift in the latter DSC energetic. A 10-minute unrestricted exposure from an open crucible essentially changed the entire complexity of the electrolyte as additional DSC endotherms were seen that were not present in the untreated sample while the latter endothermic peak shifted to lower temperatures. The TGA also exhibited evaporation/decomposition commencing at lower temperatures, a different mass-loss profile and completely different final mass-loss quantities (inputted initial sample mass was taken after elapsed sample exposure). The 1 hour fully exposed sample was also coupled to the QMS where the same mass numbers were monitored compared with the untreated sample. Mass numbers attributed to diethyl carbonate (45, 59, 63, 75 and 91) no longer showed activity in the exposed sample (Figure 9) when compared with the untreated sample (Figure 4) indicating compositional changes that resulted in different decomposition products. Figure 10 traces mass numbers corresponding to ethylene carbonate (43, 56, 58, 73 and 88) indicating its likely evolution, but peaking at a temperature approximately 30°C lower than the untreated sample. Further evidence of compositional changes in the exposed sample can be seen as mass numbers associated with POF3 (50, 69, 85 and 104) are no longer evolving (Figure 11).
Summary
Samples sensitive to ambient atmosphere, such as electrolytes used in the Lithium Ion Battery industry, need to be stored and prepared with caution. Even minimal exposure can begin to cause changes in the material leading to potential detrimental and unwanted effects as seen with the TGA, DSC and evolved gas analysis.