Introduction
Pyrolysis has emerged as a key thermochemical process in the transition toward sustainable and circular energy systems. It enables the conversion of a wide range of carbon-based feedstocks into valuable fuels, chemicals, and carbon-rich solids.
Among the various materials suitable for pyrolysis are biomass and organic waste, plastics, and rubber-based materials like waste tires. These feedstocks offer different end products, from biochar and syngas to fuels and industrial carbon materials depending on their composition and processing conditions.
Focusing on biomass as a renewable resource has significant potential in biofuel production and the generation of value-added chemicals. The conversion of biomass through processes such as pyrolysis, gasification, and combustion offers sustainable solutions to meet the growing demand for energy [1]. Among the various biomass feedstocks, olive stones stand out as a particularly valuable resource [2]. A byproduct of the olive industry, olive stones possess high energy potential due to their low moisture content and rich lignocellulosic composition. These characteristics make olive stones ideal for biofuel production through pyrolysis. Also, olive stones can be converted into biochar, activated carbon, and biochemicals, offering diverse applications beyond energy production.
This study focuses on the pyrolysis kinetics of olive stone biomass. Based on thermogravimetric measurements, a comprehensive kinetic analysis of olive stone biomass is performed using the NETZSCH Kinetics Neo software to determine key kinetic parameters and perform process optimization through simulation.
Kondisi Pengukuran
Kondisi pengukuran dirinci dalam tabel 1. Kurva TGA yang diperoleh merupakan dasar untuk evaluasi kinetik Reaksi penguraianReaksi penguraian adalah reaksi yang diinduksi secara termal dari senyawa kimia yang membentuk produk padat dan/atau gas. reaksi penguraian.
Tabel 1: Parameter uji analisis termogravimetri (TG)
| Instrumen | NETZSCH TG 309 Classic |
|---|---|
| Wadah | Al2O3, terbuka |
| Massa sampel | 9.65 mg hingga 9,85 mg |
| Kisaran suhu | 25 ° C hingga 1000 ° C |
| Atmosfer | Nitrogen (40 ml/menit), beralih ke udara sintetis (40 ml/menit) pada suhu 900°C |
| Tingkat pemanasan | 2.5 K/menit, 5 K/menit, 7,5 K/menit, 10 K/menit, 15 K/menit, 20 K/menit, |
Measurement Results
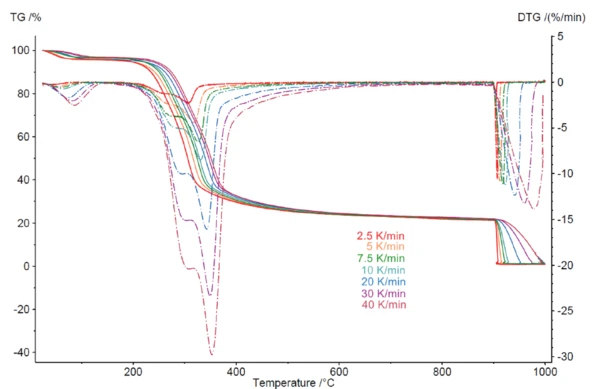
Pengukuran TGA pada gambar 1 menggambarkan kurva TGA dan DTG (turunan pertama) dari pengukuran pada batu zaitun dengan laju pemanasan 2,5, 5, 7,5, 10, 20, 30, dan 40 K/menit dalam atmosfer lembam. Langkah kehilangan massa pertama, terdeteksi antara suhu kamar dan 130°C, dihasilkan dari PenguapanPenguapan suatu unsur atau senyawa adalah transisi fase dari fase cair ke uap. Ada dua jenis penguapan: penguapan dan pendidihan.penguapan uap air dan disertai dengan kehilangan massa sebesar 3,3% [3]. Setelah proses dehidrasi, beberapa langkah kehilangan massa yang tumpang tindih terjadi pada suhu antara 130°C dan 700°C, dikaitkan dengan degradasi termal hemiselulosa; hal ini diikuti oleh degradasi selulosa, dan akhirnya kehilangan massa yang berkepanjangan, yang dapat dikaitkan dengan degradasi lignin [4]. Kehilangan massa yang diamati pada suhu di atas 700°C disebabkan oleh degradasi termal dari struktur lignin yang tahan banting [5]. Mereka bergeser ke suhu yang lebih tinggi dengan meningkatnya laju pemanasan (pengaruh kinetik) [6].
Analisis Kinetik Dekomposisi Termal
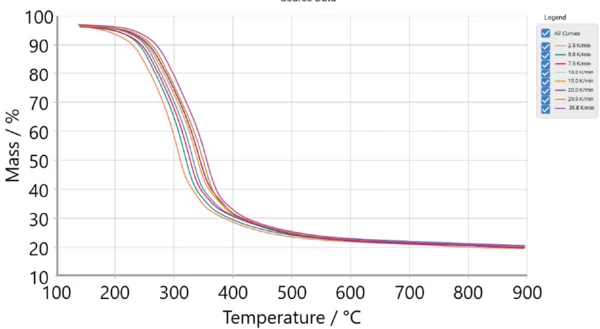
Dengan menggunakan perangkat lunak NETZSCH Kinetics Neo , ketergantungan proses dekomposisi pada laju pemanasan dapat dievaluasi. Profil TGA untuk laju 40 K/menit digambarkan pada gambar 2. Pengamatan ini menunjukkan bahwa proses PirolisisPirolisis adalah penguraian termal senyawa organik dalam atmosfer inert.pirolisis tidak sepenuhnya selesai pada suhu 700°C, melainkan berlangsung secara bertahap hingga 900°C, disertai dengan kehilangan massa. Langkah kehilangan massa awal sebelum 140°C, yang berkaitan dengan penghilangan uap air, tidak diperhitungkan dalam data yang menjadi sasaran analisis kinetik [3]. Ketika beralih dari nitrogen ke oksigen pada suhu 900°C, kehilangan massa terjadi karena pembakaran. Data ini tidak termasuk dalam analisis kinetik. Gambar 2 menunjukkan kurva pengukuran TGA antara 130°C dan 900°C yang digunakan untuk evaluasi kinetik.
The degree of conversion, α, is calculated by Kinetics Neo software from thermogravimetry measurements where α ranges from 0 to 1 (Eq 1).
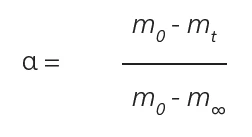
m0: initial mass
mt: mass at time t
m∞: final mass
Due to the complexity of biomass, a detailed understanding of reaction kinetics is essential for designing efficient reactors and optimizing process conditions [8]. The pyrolysis of hemicellulose begins at a relatively low temperature (~200°C) [9]. Cellulose decomposition involves multiple steps, including the formation of an amorphous intermediate and the production of levoglucosan [10]. Lignin is the most stable component due to its aromatic ring structure, with decomposition occurring over a temperature range from 170°C to the end of the process [3].
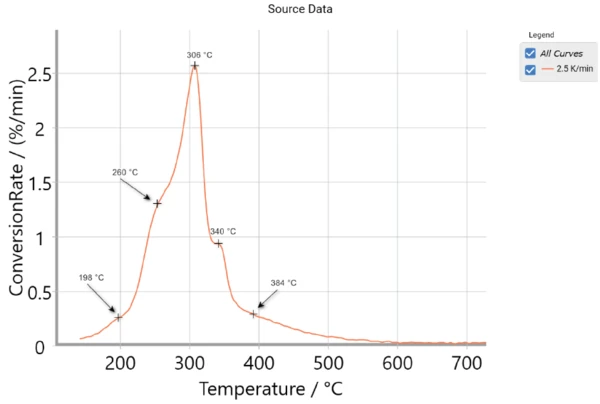
The thermal decomposition of olive stone occurs in multiple stages, as illustrated in figure 3, where the conversion rate is defined as the first derivative of conversion with respect to time. The first shoulder at 198°C marks the early decomposition of hemicellulose, followed by its main decomposition phase around 260°C. The primary breakdown of cellulose occurs at the main peak near 306°C with a late decomposition stage at 340°C. Finally, lignin decomposes slowly, showing a final shoulder at 384°C. [7]
This suggests a multi-step reaction process, which can be modeled with a five-step kinetic model:
A → B → C → D → E
F → G
The reaction rate of each step, j, is described by the function (Eq 2):
Reaction Rate j = Aj · f(ej, pj) · exp (-Ej/(RT)) (Eq 2)
Aj: pre-exponential factor
Ej: activation energy [J/mol]
T: temperature [K]
R: gas constant (8.314 J/K.mol)
f (ej ,pj): function dependent on the concentration of the initial reactant, ej, and the concentration of product, pj
Dekomposisi termal dari batu zaitun dapat dilengkapi dengan lima puncak, sesuai dengan jumlah puncak pada suhu 198°C, 260°C, 306°C, 340°C, dan 384°C, seperti yang ditunjukkan pada gambar 4. Puncak-puncak ini mewakili dekomposisi berurutan dari hemiselulosa, selulosa, dan lignin selama proses PirolisisPirolisis adalah penguraian termal senyawa organik dalam atmosfer inert.pirolisis [6].
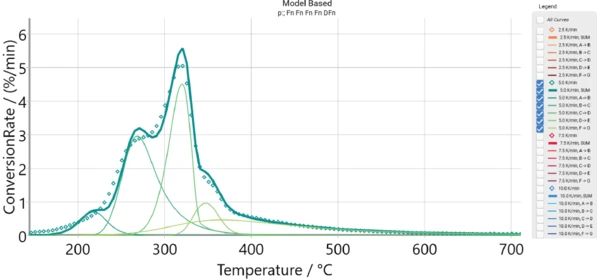
The measured data is presented as arhombus line, the thick green curve is the sum of the individual reaction steps. The good agreement between experimental and simulated data confirms the assumption of a 5-step process.
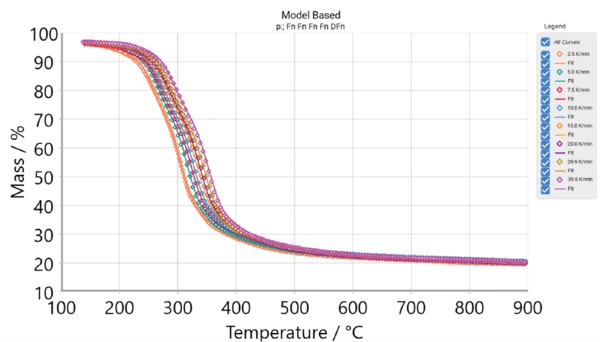
Figure 5 shows the measured TGA curves as well as the curves calculated using the five-step kinetics model in the NETZSCH Kinetics Neo software. Table 2 summarizes the parameters of the kinetics. The results demonstrate strong agreement between the measured and calculated data, with a coefficient of determination of 0.999.
Tabel 2: Parameter kinetik degradasi termal batu zaitun
Langkah reaksi | A → B Fn1 | B → C Fn1 | C → D Fn1 | D → E Fn2 | F → G DFn2 |
|---|---|---|---|---|---|
| Energi aktivasi [kJ/mol] | 151.824 | 165.479 | 194.592 | 206.720 | 179.468 |
| Log (Pra-Exp) Log (1/s) | 14.083 | 13.792 | 15.116 | 15.286 | 12.093 |
| Urutan reaksi | 1.832 | 2.732 | 1.039 | 1.466 | 6.304 |
| Kontribusi | 0.061 | 0.336 | 0.313 | 0.073 | 0.217 |
| Koefisien determinasi | 0.999 |
1Fn: Reaksi orde ke-n
2DFn: Difusi satu dimensi orde ke-n
Simulasi: Pengoptimalan Proses
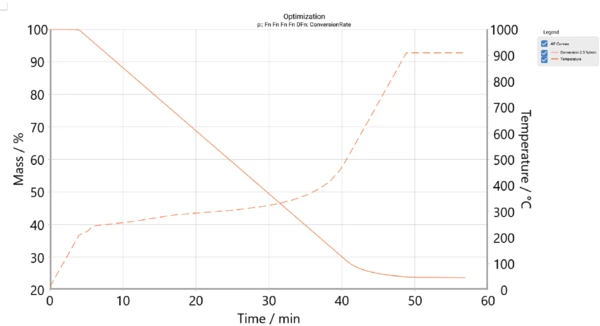
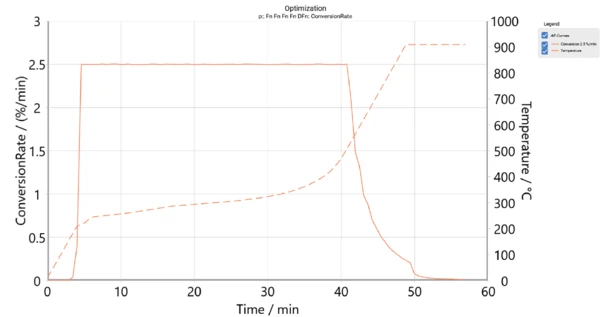
Following kinetic analysis and the determination of all relevant kinetic parameters, the next step involves process optimization as shown in figures 6 and 7. At this stage, the goal is to control the decomposition process by adjusting the conversion rate in order to minimize the total time required to achieve the desired conversion. Figure 7 presents the temperature program and time for a 2.5%/min conversion rate, corresponding to the simulated conversion rate.
Conclusion
Analisis kinetik yang komprehensif dapat dilakukan dengan menggabungkan pengukuran TGA NETZSCH dengan perangkat lunak NETZSCH Kinetics Neo . Penentuan parameter kinetik yang dihasilkan memungkinkan pengoptimalan proses, meningkatkan efisiensi secara keseluruhan, dan meminimalkan total waktu yang diperlukan untuk mencapai konversi yang diinginkan. Parameter kinetik yang akurat sangat penting untuk merancang reaktor yang efisien yang meningkatkan kinerja proses secara keseluruhan. Pendekatan ini dapat diterapkan pada berbagai bahan baku seperti biomassa, plastik, dan karet.