Introduction
Pyrolysis has emerged as a key thermochemical process in the transition toward sustainable and circular energy systems. It enables the conversion of a wide range of carbon-based feedstocks into valuable fuels, chemicals, and carbon-rich solids.
Among the various materials suitable for pyrolysis are biomass and organic waste, plastics, and rubber-based materials like waste tires. These feedstocks offer different end products, from biochar and syngas to fuels and industrial carbon materials depending on their composition and processing conditions.
Focusing on biomass as a renewable resource has significant potential in biofuel production and the generation of value-added chemicals. The conversion of biomass through processes such as pyrolysis, gasification, and combustion offers sustainable solutions to meet the growing demand for energy [1]. Among the various biomass feedstocks, olive stones stand out as a particularly valuable resource [2]. A byproduct of the olive industry, olive stones possess high energy potential due to their low moisture content and rich lignocellulosic composition. These characteristics make olive stones ideal for biofuel production through pyrolysis. Also, olive stones can be converted into biochar, activated carbon, and biochemicals, offering diverse applications beyond energy production.
This study focuses on the pyrolysis kinetics of olive stone biomass. Based on thermogravimetric measurements, a comprehensive kinetic analysis of olive stone biomass is performed using the NETZSCH Kinetics Neo software to determine key kinetic parameters and perform process optimization through simulation.
Mätförhållanden
Mätförhållandena beskrivs närmare i tabell 1. De erhållna TGA-kurvorna ligger till grund för den kinetiska utvärderingen av nedbrytningsreaktionen.
Tabell 1: Testparametrar för termogravimetrisk analys (TG)
| Instrument | NETZSCH TG 309 Classic |
|---|---|
| Smältdegel | Al2O3, öppen |
| Provets massa | 9.65 mg till 9,85 mg |
| Temperaturområde | 25°C till 1000°C |
| Atmosfär | Kväve (40 ml/min), byt till syntetisk luft (40 ml/min) vid 900°C |
| Uppvärmningshastigheter | 2.5 K/min, 5 K/min, 7,5 K/min, 10 K/min, 15 K/min, 20 K/min, |
Measurement Results
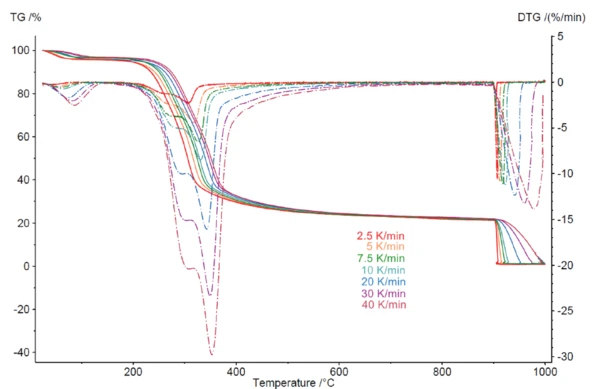
TGA-mätningarna i figur 1 visar TGA- och DTG-kurvorna (första derivatan) för mätningarna på olivsten vid uppvärmningshastigheter på 2,5, 5, 7,5, 10, 20, 30 och 40 K/min under en inert atmosfär. Det första massförluststeget, som detekteras mellan rumstemperatur och 130 °C, beror på fuktavdunstning och åtföljs av en massförlust på 3,3 % [3]. Efter dehydratiseringsprocessen sker flera överlappande massförluststeg vid temperaturer mellan 130°C och 700°C, vilket tillskrivs den termiska nedbrytningen av hemicellulosa; detta följs av cellulosanedbrytning och slutligen en långvarig massförlust, som kan tillskrivas nedbrytningen av lignin [4]. Massaförlusterna som observeras vid temperaturer över 700°C beror på termisk nedbrytning av elastiska ligninstrukturer [5]. De förskjuts till högre temperaturer med ökande uppvärmningshastigheter (kinetisk påverkan) [6].
Kinetisk analys av termisk nedbrytning
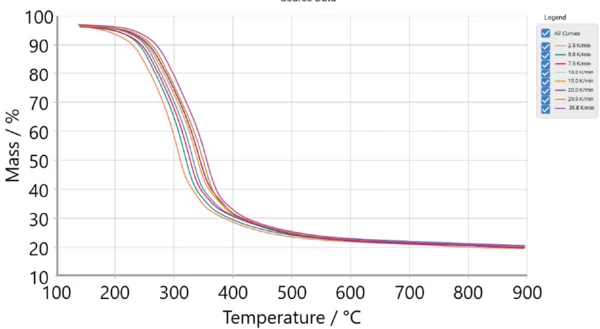
Med hjälp av programvaran NETZSCH Kinetics Neo kan nedbrytningsprocessens beroende av uppvärmningshastigheten utvärderas. TGA-profilen för en hastighet på 40 K/min visas i figur 2. Denna observation indikerar att pyrolysprocessen inte är helt avslutad vid 700°C, utan snarare fortskrider gradvis upp till 900°C, åtföljd av en massförlust. Det inledande massförluststeget före 140°C, som avser avlägsnande av fukt, beaktades inte i de data som utsattes för kinetisk analys [3]. När man byter från kväve till syre vid 900°C uppstår en massförlust på grund av förbränning. Dessa data uteslöts från den kinetiska analysen. Figur 2 visar TGA-mätkurvorna mellan 130°C och 900°C som användes för den kinetiska utvärderingen.
The degree of conversion, α, is calculated by Kinetics Neo software from thermogravimetry measurements where α ranges from 0 to 1 (Eq 1).
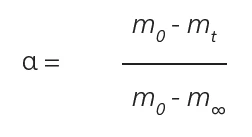
m0: initial mass
mt: mass at time t
m∞: final mass
Due to the complexity of biomass, a detailed understanding of reaction kinetics is essential for designing efficient reactors and optimizing process conditions [8]. The pyrolysis of hemicellulose begins at a relatively low temperature (~200°C) [9]. Cellulose decomposition involves multiple steps, including the formation of an amorphous intermediate and the production of levoglucosan [10]. Lignin is the most stable component due to its aromatic ring structure, with decomposition occurring over a temperature range from 170°C to the end of the process [3].
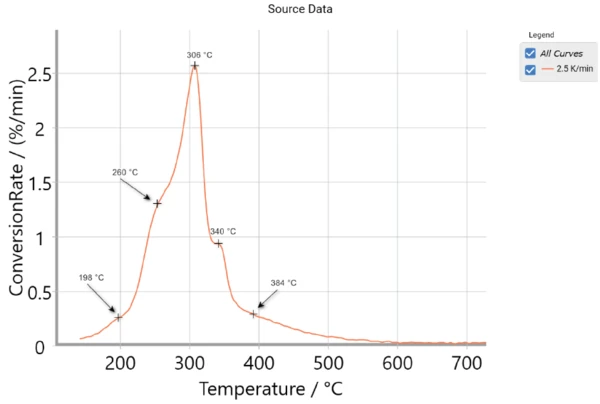
The thermal decomposition of olive stone occurs in multiple stages, as illustrated in figure 3, where the conversion rate is defined as the first derivative of conversion with respect to time. The first shoulder at 198°C marks the early decomposition of hemicellulose, followed by its main decomposition phase around 260°C. The primary breakdown of cellulose occurs at the main peak near 306°C with a late decomposition stage at 340°C. Finally, lignin decomposes slowly, showing a final shoulder at 384°C. [7]
This suggests a multi-step reaction process, which can be modeled with a five-step kinetic model:
A → B → C → D → E
F → G
The reaction rate of each step, j, is described by the function (Eq 2):
Reaction Rate j = Aj · f(ej, pj) · exp (-Ej/(RT)) (Eq 2)
Aj: pre-exponential factor
Ej: activation energy [J/mol]
T: temperature [K]
R: gas constant (8.314 J/K.mol)
f (ej ,pj): function dependent on the concentration of the initial reactant, ej, and the concentration of product, pj
Den termiska nedbrytningen av olivkärnan kan beskrivas med fem toppar, som motsvarar summan av topparna vid temperaturerna 198°C, 260°C, 306°C, 340°C och 384°C, enligt figur 4. Dessa toppar representerar den sekventiella nedbrytningen av hemicellulosa, cellulosa och lignin under pyrolysprocessen [6].
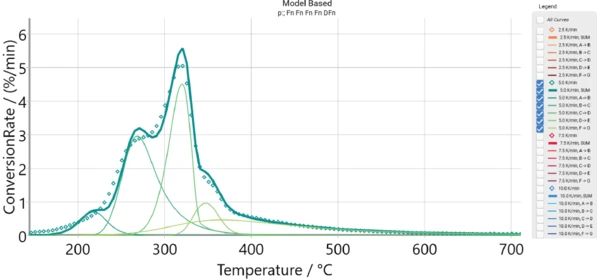
The measured data is presented as arhombus line, the thick green curve is the sum of the individual reaction steps. The good agreement between experimental and simulated data confirms the assumption of a 5-step process.
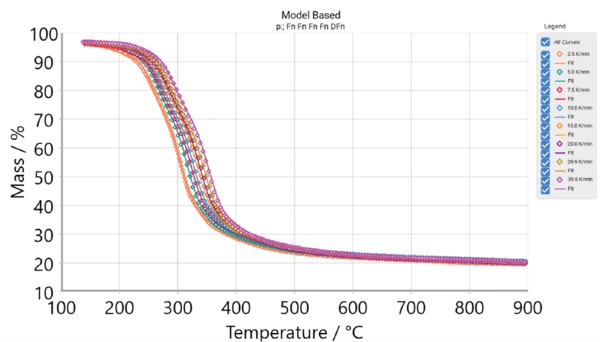
Figure 5 shows the measured TGA curves as well as the curves calculated using the five-step kinetics model in the NETZSCH Kinetics Neo software. Table 2 summarizes the parameters of the kinetics. The results demonstrate strong agreement between the measured and calculated data, with a coefficient of determination of 0.999.
Tabell 2: Kinetiska parametrar för termisk nedbrytning av olivkärnor
Reaktionssteg | A → B Fn1 | B → C Fn1 | C → D Fn1 | D → E Fn2 | F → G DFn2 |
|---|---|---|---|---|---|
| Aktiveringsenergi [kJ/mol] | 151.824 | 165.479 | 194.592 | 206.720 | 179.468 |
| Log (Pre-Exp) Log (1/s) | 14.083 | 13.792 | 15.116 | 15.286 | 12.093 |
| Reaktionsordning | 1.832 | 2.732 | 1.039 | 1.466 | 6.304 |
| Bidrag till | 0.061 | 0.336 | 0.313 | 0.073 | 0.217 |
| Bestämningskoefficient | 0.999 |
1Fn: Reaktion av n:te ordningen
2DFn: Endimensionell diffusion av nionde ordningen
Simulering: Processoptimering
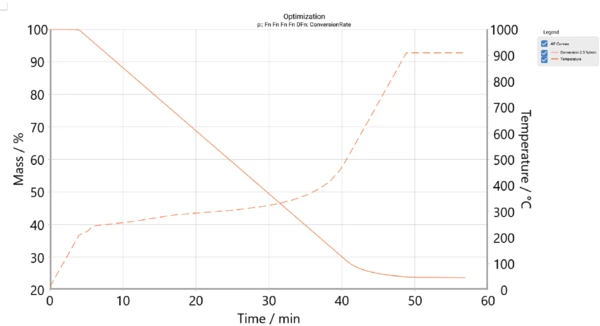
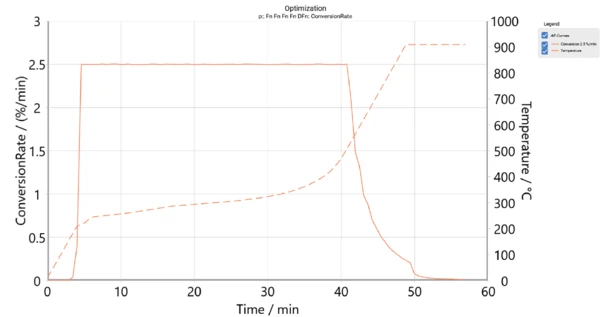
Following kinetic analysis and the determination of all relevant kinetic parameters, the next step involves process optimization as shown in figures 6 and 7. At this stage, the goal is to control the decomposition process by adjusting the conversion rate in order to minimize the total time required to achieve the desired conversion. Figure 7 presents the temperature program and time for a 2.5%/min conversion rate, corresponding to the simulated conversion rate.
Conclusion
En omfattande kinetisk analys kan utföras genom att kombinera NETZSCH TGA-mätningar med programvaran NETZSCH Kinetics Neo . Den resulterande bestämningen av kinetiska parametrar möjliggör processoptimering, vilket förbättrar den totala effektiviteten och minimerar den totala tid som krävs för att uppnå önskad omvandling. Exakta kinetiska parametrar är avgörande för att utforma effektiva reaktorer som förbättrar processens totala prestanda. Detta tillvägagångssätt kan tillämpas på ett brett spektrum av råmaterial, t.ex. biomassa, plast och gummi.