Introduction
Pyrolysis has emerged as a key thermochemical process in the transition toward sustainable and circular energy systems. It enables the conversion of a wide range of carbon-based feedstocks into valuable fuels, chemicals, and carbon-rich solids.
Among the various materials suitable for pyrolysis are biomass and organic waste, plastics, and rubber-based materials like waste tires. These feedstocks offer different end products, from biochar and syngas to fuels and industrial carbon materials depending on their composition and processing conditions.
Focusing on biomass as a renewable resource has significant potential in biofuel production and the generation of value-added chemicals. The conversion of biomass through processes such as pyrolysis, gasification, and combustion offers sustainable solutions to meet the growing demand for energy [1]. Among the various biomass feedstocks, olive stones stand out as a particularly valuable resource [2]. A byproduct of the olive industry, olive stones possess high energy potential due to their low moisture content and rich lignocellulosic composition. These characteristics make olive stones ideal for biofuel production through pyrolysis. Also, olive stones can be converted into biochar, activated carbon, and biochemicals, offering diverse applications beyond energy production.
This study focuses on the pyrolysis kinetics of olive stone biomass. Based on thermogravimetric measurements, a comprehensive kinetic analysis of olive stone biomass is performed using the NETZSCH Kinetics Neo software to determine key kinetic parameters and perform process optimization through simulation.
Warunki pomiaru
Warunki pomiaru wyszczególniono w tabeli 1. Uzyskane krzywe TGA są podstawą do kinetycznej oceny reakcji rozkładu.
Tabela 1: Parametry testu analizy termograwimetrycznej (TG)
| Przyrząd | NETZSCH TG 309 Classic |
|---|---|
| Tygiel | Al2O3, otwarty |
| Masa próbki | 9.65 mg do 9,85 mg |
| Zakres temperatur | 25°C do 1000°C |
| Atmosfera | Azot (40 ml/min), przełączenie na powietrze syntetyczne (40 ml/min) przy 900°C |
| Szybkość ogrzewania | 2.5 K/min, 5 K/min, 7,5 K/min, 10 K/min, 15 K/min, 20 K/min, |
Measurement Results
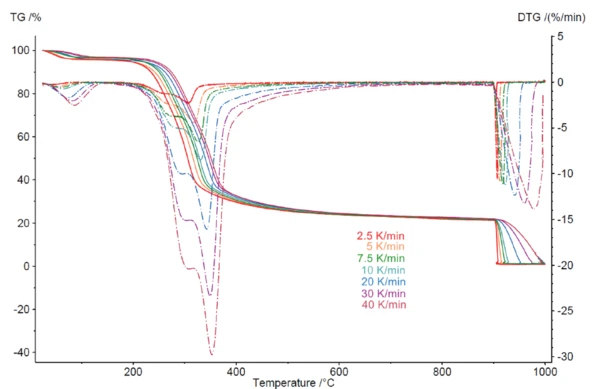
Pomiary TGA na rysunku 1 przedstawiają krzywe TGA i DTG (pierwsza pochodna) pomiarów na pestce oliwek przy szybkościach ogrzewania 2,5, 5, 7,5, 10, 20, 30 i 40 K/min w atmosferze obojętnej. Pierwszy etap utraty masy, wykryty między temperaturą pokojową a 130°C, wynika z odparowania wilgoci i towarzyszy mu utrata masy wynosząca 3,3% [3]. Po procesie odwodnienia, w temperaturach od 130°C do 700°C następuje kilka nakładających się na siebie etapów utraty masy, przypisywanych termicznej degradacji hemicelulozy; następnie następuje degradacja celulozy, a na koniec długotrwała utrata masy, którą można przypisać degradacji ligniny [4]. Ubytki masy obserwowane w temperaturach powyżej 700°C wynikają z termicznej degradacji sprężystych struktur ligninowych [5]. Są one przesuwane do wyższych temperatur wraz ze wzrostem szybkości ogrzewania (wpływ kinetyczny) [6].
Analiza kinetyczna rozkładu termicznego
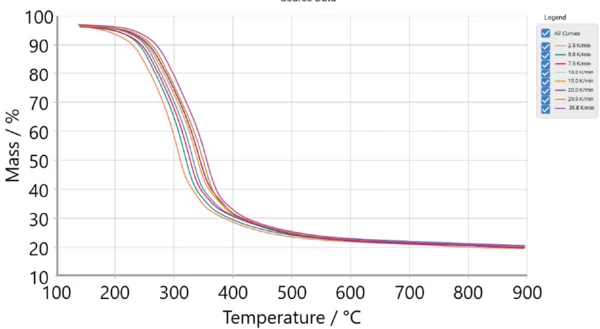
Za pomocą oprogramowania NETZSCH Kinetics Neo można ocenić zależność procesu rozkładu od szybkości ogrzewania. Profil TGA dla szybkości 40 K/min przedstawiono na rysunku 2. Obserwacja ta wskazuje, że proces pirolizy nie jest w pełni zakończony w temperaturze 700°C, ale raczej przebiega stopniowo do 900°C, czemu towarzyszy utrata masy. Początkowy etap utraty masy przed 140°C, który dotyczy usuwania wilgoci, nie został uwzględniony w danych poddanych analizie kinetycznej [3]. Podczas przełączania z azotu na tlen w temperaturze 900°C następuje utrata masy w wyniku spalania. Dane te zostały wyłączone z analizy kinetycznej. Rysunek 2 przedstawia krzywe pomiarowe TGA w zakresie od 130°C do 900°C wykorzystane do oceny kinetycznej.
The degree of conversion, α, is calculated by Kinetics Neo software from thermogravimetry measurements where α ranges from 0 to 1 (Eq 1).
m0: initial mass
mt: mass at time t
m∞: final mass
Due to the complexity of biomass, a detailed understanding of reaction kinetics is essential for designing efficient reactors and optimizing process conditions [8]. The pyrolysis of hemicellulose begins at a relatively low temperature (~200°C) [9]. Cellulose decomposition involves multiple steps, including the formation of an amorphous intermediate and the production of levoglucosan [10]. Lignin is the most stable component due to its aromatic ring structure, with decomposition occurring over a temperature range from 170°C to the end of the process [3].
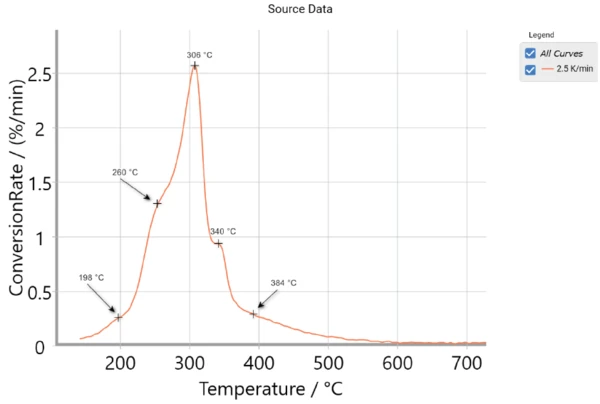
The thermal decomposition of olive stone occurs in multiple stages, as illustrated in figure 3, where the conversion rate is defined as the first derivative of conversion with respect to time. The first shoulder at 198°C marks the early decomposition of hemicellulose, followed by its main decomposition phase around 260°C. The primary breakdown of cellulose occurs at the main peak near 306°C with a late decomposition stage at 340°C. Finally, lignin decomposes slowly, showing a final shoulder at 384°C. [7]
This suggests a multi-step reaction process, which can be modeled with a five-step kinetic model:
A → B → C → D → E
F → G
The reaction rate of each step, j, is described by the function (Eq 2):
Reaction Rate j = Aj · f(ej, pj) · exp (-Ej/(RT)) (Eq 2)
Aj: pre-exponential factor
Ej: activation energy [J/mol]
T: temperature [K]
R: gas constant (8.314 J/K.mol)
f (ej ,pj): function dependent on the concentration of the initial reactant, ej, and the concentration of product, pj
Rozkład termiczny pestek oliwek można opisać za pomocą pięciu pików, odpowiadających sumie pików w temperaturach 198°C, 260°C, 306°C, 340°C i 384°C, jak pokazano na rysunku 4. Piki te reprezentują sekwencyjny Reakcja rozkładuReakcja rozkładu to wywołana termicznie reakcja związku chemicznego tworząca produkty stałe i/lub gazowe. rozkład hemicelulozy, celulozy i ligniny podczas procesu pirolizy [6].
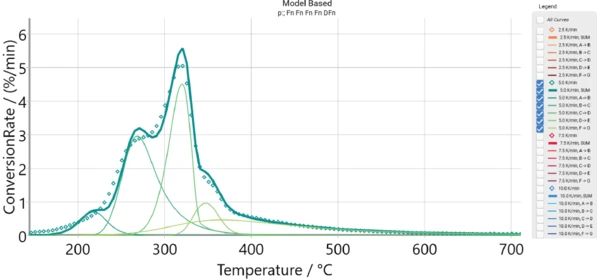
The measured data is presented as arhombus line, the thick green curve is the sum of the individual reaction steps. The good agreement between experimental and simulated data confirms the assumption of a 5-step process.
Figure 5 shows the measured TGA curves as well as the curves calculated using the five-step kinetics model in the NETZSCH Kinetics Neo software. Table 2 summarizes the parameters of the kinetics. The results demonstrate strong agreement between the measured and calculated data, with a coefficient of determination of 0.999.
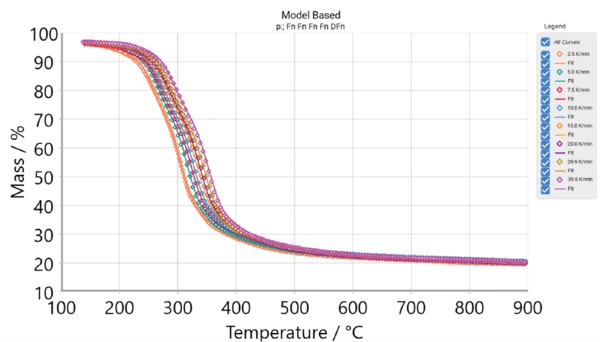
Tabela 2: Parametry kinetyczne degradacji termicznej pestek oliwek
Etap reakcji | A → B Fn1 | B → C Fn1 | C → D Fn1 | D → E Fn2 | F → G DFn2 |
|---|---|---|---|---|---|
| Energia aktywacji [kJ/mol] | 151.824 | 165.479 | 194.592 | 206.720 | 179.468 |
| Log (Pre-Exp) Log (1/s) | 14.083 | 13.792 | 15.116 | 15.286 | 12.093 |
| Kolejność reakcji | 1.832 | 2.732 | 1.039 | 1.466 | 6.304 |
| Wkład | 0.061 | 0.336 | 0.313 | 0.073 | 0.217 |
| Współczynnik determinacji | 0.999 |
1Fn: Reakcja n-tego rzędu
2DFn: Dyfuzja jednowymiarowa n-tego rzędu
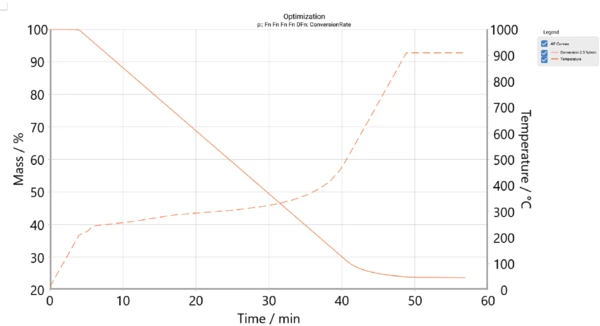
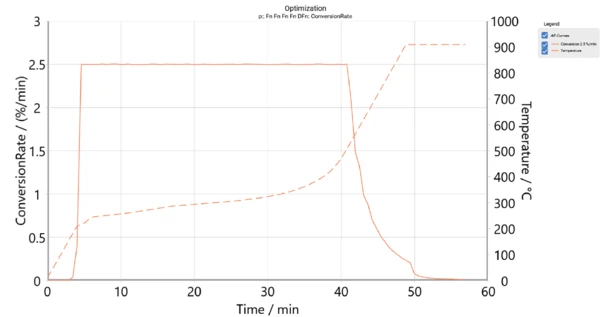
Symulacja: Optymalizacja procesu
Following kinetic analysis and the determination of all relevant kinetic parameters, the next step involves process optimization as shown in figures 6 and 7. At this stage, the goal is to control the decomposition process by adjusting the conversion rate in order to minimize the total time required to achieve the desired conversion. Figure 7 presents the temperature program and time for a 2.5%/min conversion rate, corresponding to the simulated conversion rate.
Conclusion
Kompleksową analizę kinetyczną można przeprowadzić łącząc pomiary NETZSCH TGA z oprogramowaniem NETZSCH Kinetics Neo . Wynikowe określenie parametrów kinetycznych pozwala na optymalizację procesu, zwiększając ogólną wydajność i minimalizując całkowity czas wymagany do osiągnięcia pożądanej konwersji. Dokładne parametry kinetyczne są niezbędne do projektowania wydajnych reaktorów, które zwiększają ogólną wydajność procesu. Podejście to można zastosować do szerokiej gamy materiałów wsadowych, takich jak biomasa, tworzywa sztuczne i guma.