Introduction
Pyrolysis has emerged as a key thermochemical process in the transition toward sustainable and circular energy systems. It enables the conversion of a wide range of carbon-based feedstocks into valuable fuels, chemicals, and carbon-rich solids.
Among the various materials suitable for pyrolysis are biomass and organic waste, plastics, and rubber-based materials like waste tires. These feedstocks offer different end products, from biochar and syngas to fuels and industrial carbon materials depending on their composition and processing conditions.
Focusing on biomass as a renewable resource has significant potential in biofuel production and the generation of value-added chemicals. The conversion of biomass through processes such as pyrolysis, gasification, and combustion offers sustainable solutions to meet the growing demand for energy [1]. Among the various biomass feedstocks, olive stones stand out as a particularly valuable resource [2]. A byproduct of the olive industry, olive stones possess high energy potential due to their low moisture content and rich lignocellulosic composition. These characteristics make olive stones ideal for biofuel production through pyrolysis. Also, olive stones can be converted into biochar, activated carbon, and biochemicals, offering diverse applications beyond energy production.
This study focuses on the pyrolysis kinetics of olive stone biomass. Based on thermogravimetric measurements, a comprehensive kinetic analysis of olive stone biomass is performed using the NETZSCH Kinetics Neo software to determine key kinetic parameters and perform process optimization through simulation.
Условия измерения
Условия измерений подробно описаны в таблице 1. Полученные кривые ТГА являются основой для кинетической оценки реакции разложения.
Таблица 1: Параметры термогравиметрического анализа (ТГ)
| Прибор | NETZSCH ТГ 309 Classic |
|---|---|
| Крюшон | Al2O3, открытый |
| Масса образца | 9.65 мг - 9,85 мг |
| Диапазон температур | от 25°C до 1000°C |
| Атмосфера | Азот (40 мл/мин), переход на синтетический воздух (40 мл/мин) при 900°C |
| Скорость нагрева | 2.5 К/мин, 5 К/мин, 7,5 К/мин, 10 К/мин, 15 К/мин, 20 К/мин, |
Measurement Results
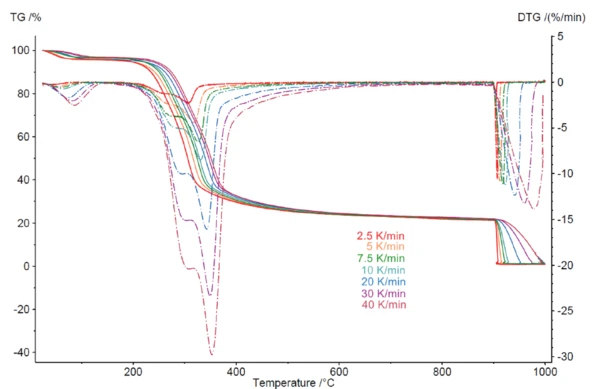
На рисунке 1 представлены кривые ТГА и ДТГ (первая производная) измерений на оливковой косточке при скоростях нагрева 2,5, 5, 7,5, 10, 20, 30 и 40 К/мин в инертной атмосфере. Первый этап потери массы, обнаруженный между комнатной температурой и 130°C, обусловлен испарением влаги и сопровождается потерей массы на 3,3% [3]. После процесса дегидратации происходит несколько перекрывающихся этапов потери массы при температурах от 130°C до 700°C, что объясняется термической деградацией гемицеллюлозы; затем следует деградация целлюлозы, и, наконец, длительная потеря массы, которая может быть связана с деградацией лигнина [4]. Потери массы, наблюдаемые при температурах выше 700°C, обусловлены термической деградацией упругих структур лигнина [5]. Они смещаются к более высоким температурам с увеличением скорости нагрева (кинетическое влияние) [6].
Кинетический анализ термического разложения
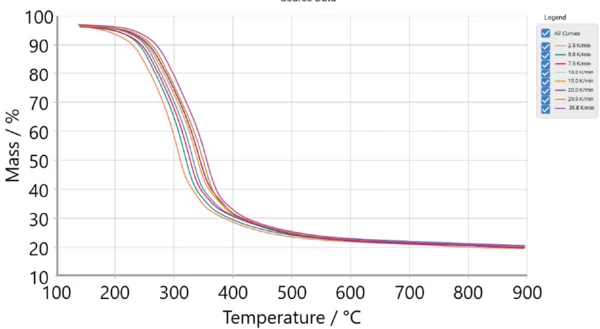
С помощью программы NETZSCH Kinetics Neo можно оценить зависимость процесса разложения от скорости нагрева. Профиль ТГА для скорости 40 К/мин представлен на рисунке 2. Это наблюдение показывает, что процесс пиролиза не завершается полностью к 700°C, а протекает постепенно до 900°C, сопровождаясь потерей массы. Начальный этап потери массы до 140°C, связанный с удалением влаги, не был учтен в данных, подвергнутых кинетическому анализу [3]. При переходе от азота к кислороду при 900°C происходит потеря массы из-за сгорания. Эти данные были исключены из кинетического анализа. На рисунке 2 представлены кривые ТГА-измерений при температурах от 130 до 900°C, использованные для кинетической оценки.
The degree of conversion, α, is calculated by Kinetics Neo software from thermogravimetry measurements where α ranges from 0 to 1 (Eq 1).
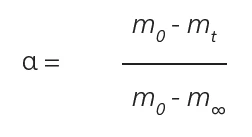
m0: initial mass
mt: mass at time t
m∞: final mass
Due to the complexity of biomass, a detailed understanding of reaction kinetics is essential for designing efficient reactors and optimizing process conditions [8]. The pyrolysis of hemicellulose begins at a relatively low temperature (~200°C) [9]. Cellulose decomposition involves multiple steps, including the formation of an amorphous intermediate and the production of levoglucosan [10]. Lignin is the most stable component due to its aromatic ring structure, with decomposition occurring over a temperature range from 170°C to the end of the process [3].
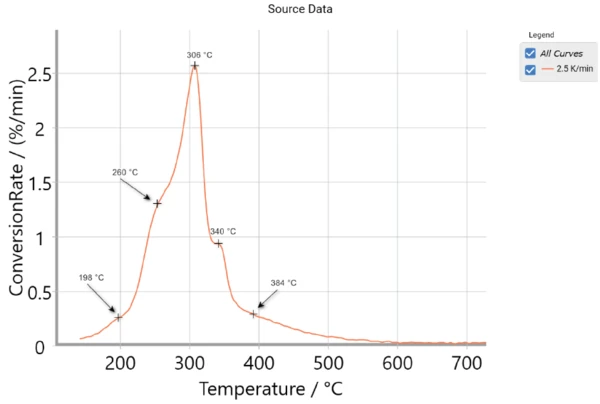
The thermal decomposition of olive stone occurs in multiple stages, as illustrated in figure 3, where the conversion rate is defined as the first derivative of conversion with respect to time. The first shoulder at 198°C marks the early decomposition of hemicellulose, followed by its main decomposition phase around 260°C. The primary breakdown of cellulose occurs at the main peak near 306°C with a late decomposition stage at 340°C. Finally, lignin decomposes slowly, showing a final shoulder at 384°C. [7]
This suggests a multi-step reaction process, which can be modeled with a five-step kinetic model:
A → B → C → D → E
F → G
The reaction rate of each step, j, is described by the function (Eq 2):
Reaction Rate j = Aj · f(ej, pj) · exp (-Ej/(RT)) (Eq 2)
Aj: pre-exponential factor
Ej: activation energy [J/mol]
T: temperature [K]
R: gas constant (8.314 J/K.mol)
f (ej ,pj): function dependent on the concentration of the initial reactant, ej, and the concentration of product, pj
Термическое разложение оливковой косточки можно представить в виде пяти пиков, соответствующих сумме пиков при температурах 198°C, 260°C, 306°C, 340°C и 384°C, как показано на рисунке 4. Эти пики представляют собой последовательное разложение гемицеллюлозы, целлюлозы и лигнина в процессе пиролиза [6].
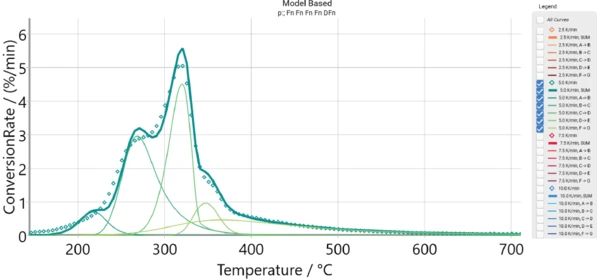
The measured data is presented as arhombus line, the thick green curve is the sum of the individual reaction steps. The good agreement between experimental and simulated data confirms the assumption of a 5-step process.
Figure 5 shows the measured TGA curves as well as the curves calculated using the five-step kinetics model in the NETZSCH Kinetics Neo software. Table 2 summarizes the parameters of the kinetics. The results demonstrate strong agreement between the measured and calculated data, with a coefficient of determination of 0.999.
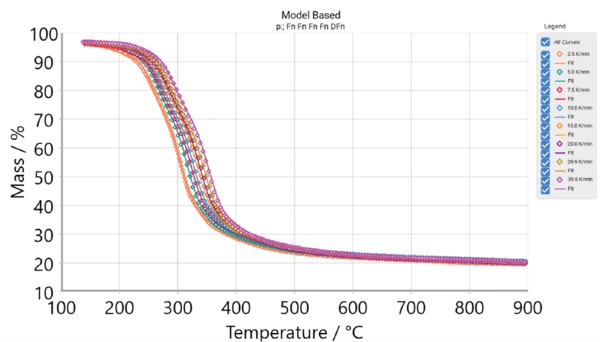
Таблица 2: Кинетические параметры термической деструкции оливковой косточки
Шаг реакции | A → B Fn1 | B → C Fn1 | C → D Fn1 | D → E Fn2 | F → G DFn2 |
|---|---|---|---|---|---|
| Энергия активации [кДж/моль] | 151.824 | 165.479 | 194.592 | 206.720 | 179.468 |
| Log (Pre-Exp) Log (1/s) | 14.083 | 13.792 | 15.116 | 15.286 | 12.093 |
| Порядок реакции | 1.832 | 2.732 | 1.039 | 1.466 | 6.304 |
| Взнос | 0.061 | 0.336 | 0.313 | 0.073 | 0.217 |
| Коэффициент детерминации | 0.999 |
1Fn: Реакция n-го порядка
2DFn: Одномерная диффузия n-го порядка
Моделирование: Оптимизация процессов
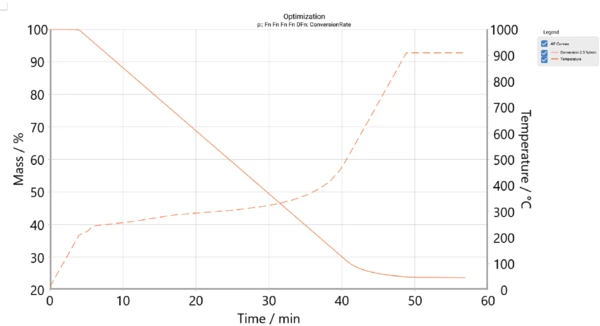
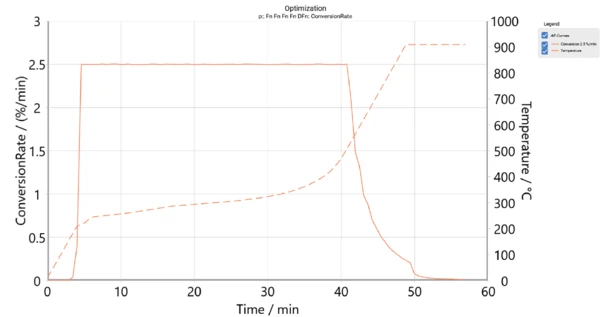
Following kinetic analysis and the determination of all relevant kinetic parameters, the next step involves process optimization as shown in figures 6 and 7. At this stage, the goal is to control the decomposition process by adjusting the conversion rate in order to minimize the total time required to achieve the desired conversion. Figure 7 presents the temperature program and time for a 2.5%/min conversion rate, corresponding to the simulated conversion rate.
Conclusion
Комплексный кинетический анализ можно провести, объединив измерения NETZSCH TGA с программным обеспечением NETZSCH Kinetics Neo . Определение кинетических параметров позволяет оптимизировать процесс, повышая общую эффективность и минимизируя общее время, необходимое для достижения желаемой конверсии. Точные кинетические параметры необходимы для проектирования эффективных реакторов, повышающих общую производительность процесса. Данный подход может быть применен к широкому спектру исходных материалов, таких как биомасса, пластмассы и каучук.