Introduction
During injection molding, a tempered mold cavity is filled volumetrically with a thermoplastic polymer melt, followed by a holding pressure to compensate shrinkage of the polymer during crystallization, before cooling and ejection of the finished part.
The longest part of this molding cycle is the cooling time, determined by the melt and mold temperatures as well as the time before the ejection of the polymer is possible. The demand for decreasing it is a permanent need in order to increase the output.
Potential to shorten cycle times can be exploited by the reduction of the melt and mold temperatures. But this may negatively influence the flowability of the melt and the crystallinity of the final product and therefore, its mechanical properties.
A possibility to shorten cycle times is the increase of the ejection temperature by increasing the crystallization temperature. This can be achieved by adding nucleating agents. Moreover, a well-distributed nucleating agent increases the number of cell nuclei leading to a reduction of the final spherolite size. The so-called clarifying agents lead to a decreased haze and an increased clarity of e.g., transparent polypropylene products [1].
The crystallization behavior of thermoplastics and its dependence on temperature, additive type and additive concentration can be investigated with isothermal crystallization experiments by means of DSC. These experiments allow for the investigation of the right additive formulation as well as optimized processing parameters for the injection molding.
Until now, isothermal crystallization of polyolefins was not easy to measure in heat flux DSCs for two reasons. Firstly, the process is very fast, so that the polymer already crystallizes during cooling if the isothermal temperature of crystallization is not achieved fast enough. Moreover, an even short temperature undershot under the programmed isothermal segment would unintentionally induce the start of the crystallization. This combination of fast cooling rates and fast equilibration at the target temperature without undershot usually made power-compensated DSCs better suited for this type of measurements than the heavier, but more robust heat flux DSCs.
Isothermal Crystallization of LDPE (Low-Density Polyethylene) Conditions
LDPE is one of the most challenging semi-crystalline thermoplastics to carry out isothermal crystallization experiments by means of DSC because of its fast crystallization behavior, associated with a very high activation energy, and its low crystallization temperature around 100°C.
The DSC 214 Polyma was used to investigate the isothermal crystallization of LDPE. Thanks to its low thermal mass Arena® furnace, it is the first DSC that combines the robustness and easy handling of a heat flux arrangement with fast heating and cooling possibilities. Proper control parameters were used in order to optimize the changeover from the fast cooling to the isothermal segment.
A 2.90-mg sample was heated at 20 K/min to 150°C. After a 2 minutes IsothermUntersuchungen bei geregelter und konstanter Temperatur werden als isotherm bezeichnet.isotherm, the LDPE was cooled down to the target temperature of 103°C. The temperature was kept isothermal until the end of the exothermic peak which is due to crystallization.
Test Results
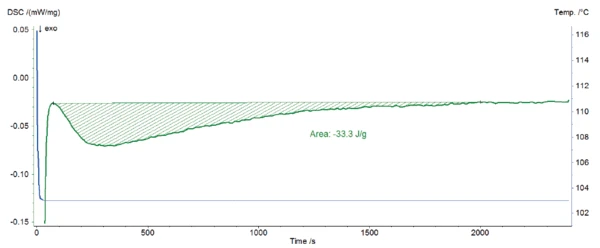
Presented in figure 1 is the temperature profile of the cooling from 150°C to 103°C and the isothermal step (blue) as well as the corresponding DSC signal (green). It shows that the target temperature is quickly achieved without undershot and that it remains stable during the complete isothermal segment. The exothermic peak detected during the isothermal segment is due to the crystallization of LDPE. It is well separated from the DSC effect coming from the change from the fast cooling to the isothermal one, which allows for correct evaluation of the peak enthalpy.
From DSC Curves to the Determination of the Crystallization Kinetics
An experimental study was carried out in order to determine the activation energy and the order of the crystal growth as a function of time, assuming that only one type of nucleation occurs and that only one crystal form is developing [2]. It can be modeled with the following equation [3]:
dα/dT = k(T)f(α),
with
dα/dt: reaction rate [s-1],
k(T): specific rate constant at temperature T, k(T) = Ze-E/RT
f(α): conversion function
The accelerating Avrami equation was used as a conversion function:
f(α) = p(1-α) [-n(1-α](p-1)p
where n and p are partial reaction order terms.
For a reaction at a specific temperature T, the Avrami equation can be cast as:
In[-In(1-α)] = Pln[k(T)] + p In[t]
corresponding to an equation: y = mx + b
with y = ln[-ln(1-α)], m = p and b = pln[k(T)].
The equation resolution requires measurements at different isothermal temperatures. Therefore, the previous measurements shown in figure 1 was repeated by using isothermal temperatures of 101.5°C, 102.5°C and 103.5°C.
The results of the four isothermal crystallization tests are displayed in figure 2.
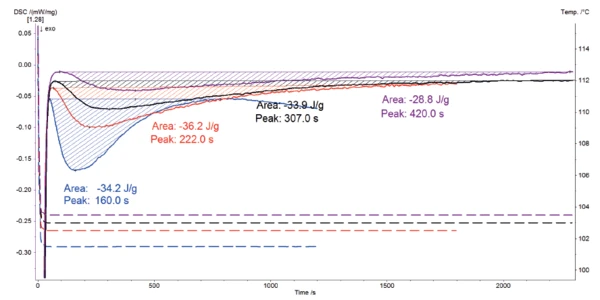
The exothermic peak detected in each of the four DSC curves is due to crystallization of LDPE. The isothermal temperature has much influence on the crystallization behavior. The crystallization enthalpy increases with a decreasing test temperature: just 28.8 J/g for the measurement at 103.5°C and 42.2 J/g if the test is only carried out at 101.5°C. The temperature also affects the crystallization rate: the lower the temperature, the faster the reaction. This is clearly demonstrated by the time achieved for each peak minimum. All results are reported in table 1.
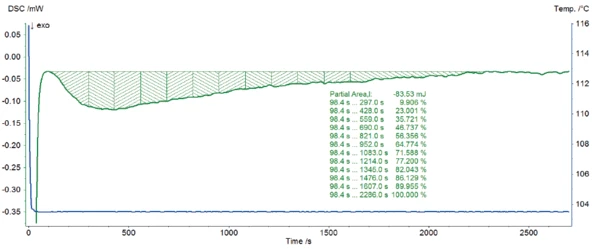
These four curves were used to carry out the kinetic analysis in accordance with the test method C for accelerating Avrami reactions described in ASTM E2070-13 (part 17). For that, the peak enthalpy was determined on each DSC curve. Then, a time interval was chosen in order to get ten time equidistant parts between approximately 10% and 90% of the complete peak area. For each of these time values, the partial area of the crystallization peak was used to determine the fraction remaining 1-α as follows:
1-α = ΔHr/ΔHc
where ΔHr is the remaining enthalpy and ΔHc the total peak enthalpy.
Table 1: Results of the isothermal crystallizatin of LDPE at four different temperatures
Isothermal temperature [°C] | Crystallization enthalpy [J/g) | Peak minimum time [2] |
|---|---|---|
| 103.5 | -28.8 | 420 |
| 103.0 | -33.9 | 307 |
| 102.5 | -36.2 | 222 |
| 101.5 | -42.2 | 160 |
An example of the calculation in the Proteus® software based on the measurement at 103.5°C is given in figure 3.
The graph ln[-ln(1-α)] as a function of ln[time] that is derived from the measured curve is depicted in figure 4. A good correlation was found between the 11 points and a linear fit which has the form y = mx + b where the slope m is the reaction order p and the intercept b is pln[k(T)]. Both the slope and intercept were used to determine ln[k(T)].
![Graph depicting the curve of In[-In(1-α)] vs. In[time] for LDPE at 103.5°C, showing a strong linear fit (R² = 0.99).](https://analyzing-testing.netzsch.com/_Resources/Persistent/2/3/a/7/23a7438f668249eed709e370f60161c0a87b5f39/NETZSCH_AN_61_Abb_4-600x348.webp)
ln[k(T)] was determined in the same way for each isothermal temperature, so that the curve ln[k(T)] as a function of 1/T could be drawn (figure 5). The correlation of these four points and the linear fit is excellent. Here again, the fit is a line of the form y = mx + b where m = -E/R and b = ln(Z) (E: activation energy, R = 8.314510 J/(K·mol), Z: pre-exponential factor)
Thanks to its slope, all kinetic parameters of the crystallization with their standard deviation [4] could be determined:
E = -612 ± 6 kJ/mol
ln(Z) = -202 ± 23
p = 1.7 ± 0.7
![Graph depicting the relationship between \( \ln[k] \) and \( 1/T \) for LDPE crystallization, illustrating linear regression results.](https://analyzing-testing.netzsch.com/_Resources/Persistent/6/d/8/1/6d81f1d973f4c8075f26dcfc9dd829921a42bd0f/NETZSCH_AN_61_Abb_5-600x424.webp)
Conclusion
The kinetic parameters of the crystallization of LDPE were determined thanks to isothermal crystallization tests at different temperatures. Such investigations are useful to find out the influence of additives as nucleating agents on the crystallization behavior of a semi-crystalline thermoplastic. Furtheron, the ideal mold temperature can be determined especially for moldings with thin walls. LDPE crystallizes very fast, so that such results can only been achieved by using a DSC instrument that combines fast cooling rates as well as fast equilibration of the DSC signal at the beginning of the isothermal segment. The DSC 214 Polyma is the first heat-flux DSC able to reach such high cooling rates and to provide a fast response time.