Introduction
Lactose is a sugar present in the milk of mammalians. It is frequently used in the pharmaceutical industry, where it serves as a binder and filler to fill out the size of tablets and capsules and as a diluent in dry-powder inhalation formulations. Lactose exists in different forms, each one having its own specific properties. For example, amorphous lactose has good compression properties, but is less stable than crystalline lactose due to its high hygroscopicity. Even the two isomers of the crystalline form (called α- and β-lactose) have very different properties. α-lactose is usually found as a monohydrate and differs from the β-form, for example, in solubility [1]. Spray-dried lactose combines two lactose types: It is a matrix of amorphous lactose in which crystals of α-lactose monohydrate are embedded.
The properties of lactose greatly depend on its chemical state: amorphous, α- or β-crystalline. Consequently, using lactose for a specific application involves its accurate identification. In the following, we show how easy-to-use thermal analysis methods allow for characterizing pharmaceutical excipients like lactose.
Identification for Quality Control – DSC Detects Crystalline and/or Amorphous Phases
DSC (differential scanning calorimetry) is a frequently used method for quality control because it combines ease of handling with the ability to automatically evaluate the measurement curves, at least for NETZSCH DSC users.
Figure 1 depicts a typical DSC curve of α-lactose monohydrate. At the beginning of the measurement, the material contains one molecule for one molecule of water. The peak detected at 146°C (peak temperature) is due to dehydration of the sample. Here, the water bound to the crystal evaporates. After this process, the lactose is in an anhydrate form. This anhydrate then melts at 216°C (peak temperature).
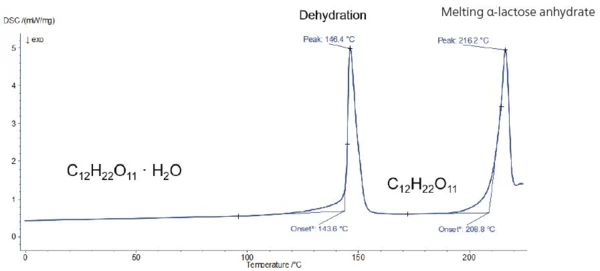
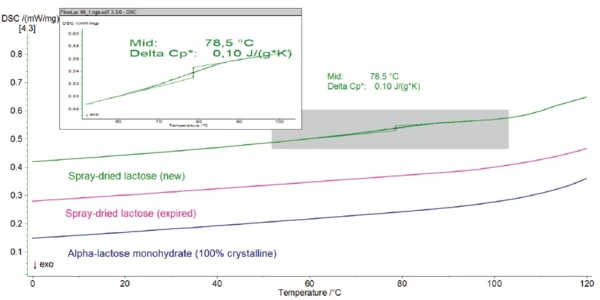
Figure 2 compares the DSC curves of α-lactose monohydrate (which is 100% crystalline) with the curves of a new spray-dried lactose and of an expired spray-dried lactose. The water evaporation peak typical for the dehydration of α-lactose monohydrate as well as the melting peak of the anhydrate lactose were detected for all three materials. Differences in the dehydration enthalpies highlight differences in the products.
- The dehydration enthalpy is higher for crystalline lactose than for spray-dried lactose (157 J/g vs. 126 J/g). This is because spray-dried lactose contains an approx. 10% amorphous phase. The enthalpy is calculated relative to the mass of the crystalline part present in the sample. This mass corresponds to 100% of the sample for the α-lactose monohydrate (complete crystalline sample) and only approx. 90% for spray-dried lactose.
- The dehydration enthalpy of the expired spray-dried lactose is very similar to the one of crystalline lactose. This shows that spray-dried lactose changed during storage.
- A look at the curves in the zoomed range between 0°C and 120°C provides an initial explanation for this behavior. A Glass Transition TemperatureThe glass transition is one of the most important properties of amorphous and semi-crystalline materials, e.g., inorganic glasses, amorphous metals, polymers, pharmaceuticals and food ingredients, etc., and describes the temperature region where the mechanical properties of the materials change from hard and brittle to more soft, deformable or rubbery.glass transition was detected only in the DSC curve of the new spray-dried lactose. It seems that during storage, the amorphous part present in the spray-dried lactose crystallizes; thus, past the date of expiration, the material no longer contains any amorphous lactose, but only the crystalline product. This conclusion is very important because the amorphous part contained in spray-dried lactose is responsible for its better compression properties over the crystalline lactose.

Amount of Water in Lactose: A Case for the Thermo-gravimetric Balance
In order to better understand the role of water for spray-dried lactose, thermogravimetric analyses (TGA) were performed. In such tests, the mass variations of the material are recorded during a specific time/temperature program.
Coupling with an FT-IR spectrometer allows for identification of the gases evolved.
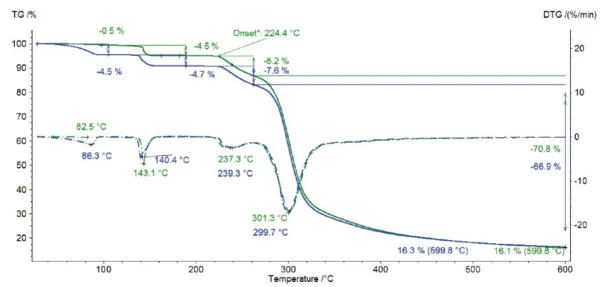
Figure 4 depicts the resulting TGA curve carried out on spray-dried lactose (green). Additionally, traces of water, carbon dioxide and ethanediol, detected by the FT-IR-spectrometer at the outlet of the thermogravimetric balance in the evolved gases, are reported in black, pink and blue. The first two mass-loss steps of 0.5% and 4.5% are related to the evolvement of water. Although the same substance evaporates, the process occurs at different temperatures. This is because the water is bound differently. The first step, related to a mass loss of 0.5%, comes from the evaporation of surface water. The second one, at 4.5%, is detected at a higher temperature and corresponds to the DSC dehydration peak shown in figure 2. It stems from the evaporation of crystal water that is bound to the lactose molecules.

The further mass-loss step detected at 224°C (onset temperature in the TGA curve) corresponds to the Decomposition reactionA decomposition reaction is a thermally induced reaction of a chemical compound forming solid and/or gaseous products. decomposition of lactose. The Decomposition reactionA decomposition reaction is a thermally induced reaction of a chemical compound forming solid and/or gaseous products. decomposition of lactose in an inert atmosphere leads to the formation of ethanediol and carbon dioxide.
The amount of crystal water can be used to calculate the proportion of α-lactose monohydrate present in the spray-dried lactose. This is possible because one
molecule of water is bound to one molecule of lactose, so a mass-loss step of 5% indicates that the material is entirely monohydrate lactose without any amorphous phase. This result is important for such applications as tablet manufacturing because amorphous and crystalline lactose differ greatly in their compression properties.
Affinity for Water
What happens if spray-dried lactose is stored in a humid atmosphere? Figure 5 presents the thermogravimetric curves of spray dried lactose, measured as received (green) compared to the resulting curve of the same sample stored two weeks in a humid atmosphere (blue).
Storage leads to a sharp increase in the amount of surface water (0.5% to 4.5%). This information is of great importance because a rise in water content may lead to powder caking. It should be noted that lactose with a particle size of 300 μm can cake easily as soon as the water content is higher than 3%. [2]
Storage in a humid atmosphere not only influences the surface water content, but also the ratio of crystalline-to-amorphous phase. Calculation of the crystal water without considering the surface water, i.e., related to the sample mass without surface water, leads to crystal water of 4.5% in the initial lactose, compared to 4.9% for lactose after storage. This means that a part of the amorphous lactose crystallized in the α-lactose monohydrate during storage in a humid atmosphere.
Amorphous lactose is very sensitive to water, in contrast with the crystalline forms of lactose, which are non-hygroscopic. Storage of spray-dried lactose in a humid atmosphere results in an increase in surface water content, and therefore in CrystallizationCrystallization is the physical process of hardening during the formation and growth of crystals. During this process, heat of crystallization is released.crystallization of the amorphous part of the product. This yields new properties in terms of compressibility and powder flowability.
Conclusion
Lactose exists in different amorphous and crystalline forms, each one having its own properties and applications in the pharmaceutical industry.
DSC is the method of choice for identifying these different forms. Complementary thermogravimetric analysis determines, very accurately, the water amount present in a lactose material and separately identifies surface and crystal water. Because there is a correlation between the crystal water amount and the α-lactose monohydrate proportion, this instrument can also be used to determine the type of lactose.
Both methods are used for quality control. They are of great importance considering that the lactose, as well as other pharmaceutical ingredients, can transform over time and under different storage conditions. Eventually, these changes will hinder production and compromise product quality. For example, during the manufacturing of a tablet, issues concerning compressibility, powder flowability and tablet stability may arise. DSC and TGA are the tools to avoid such issues.