Introduction
Many complex fluids, such as network forming polymers, surfactant mesophases and concentrated emulsions do not flow until the applied stress exceeds a certain critical value, known as the Yield StressYield stress is defined as the stress below which no flow occurs; literally behaves like a weak solid at rest and a liquid when yielded.yield stress. Materials exhibiting this behavior are said to be exhibiting yield flow behavior. The Yield StressYield stress is defined as the stress below which no flow occurs; literally behaves like a weak solid at rest and a liquid when yielded.yield stress is therefore defined as the stress that must be applied to the sample before it starts to flow. Below the Yield StressYield stress is defined as the stress below which no flow occurs; literally behaves like a weak solid at rest and a liquid when yielded.yield stress the sample will deform elastically (like stretching a spring), above the Yield StressYield stress is defined as the stress below which no flow occurs; literally behaves like a weak solid at rest and a liquid when yielded.yield stress the sample will flow like a liquid.
Most fluids with Yield StressYield stress is defined as the stress below which no flow occurs; literally behaves like a weak solid at rest and a liquid when yielded.yield stress can be considered as a structural skeleton that extends over the entire volume of the system. The strength of the skeleton is governed by the structure of the dispersed phase and its interactions. Normally, the continuous phase is low in viscosity, however high volume fractions of a dispersed phase can increase the viscosity by a thousand times and induce solid-like behavior at rest.
There are various methods for determining the yield stress [1], mostly using steady shear testing, however, one of the most sensitive methods is using an oscillatory amplitude sweep. This test involves applying an increasing stress or strain and monitoring changes in modulus and/or stress.
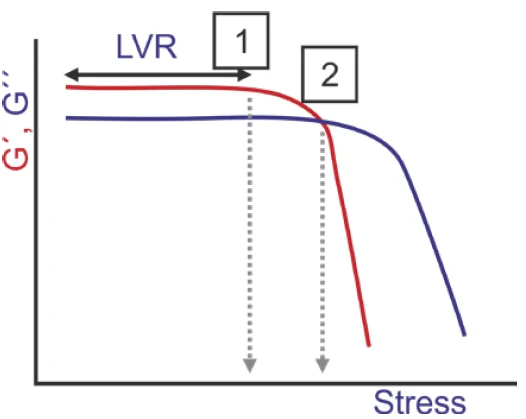
There are different ways of interpreting yield stress from an amplitude sweep as shown in Figure 1. Some workers consider the initial drop in G’ a measure of the yield point since this is represents the onset of non-linearity and structural breakdown, while others consider the G’/G” cross-over to be the yield point since this represents the transition from solid to liquid-like behavior. The zone between these events is often referred to as the yield zone.
Yield stress is defined as the stress that must be applied to the sample before it starts to flow.
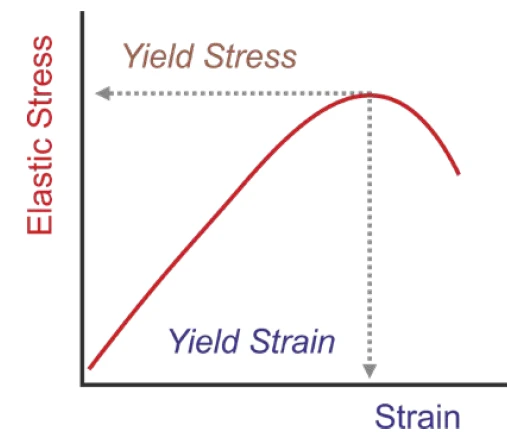
A more recent method involves measuring the elastic stress component, σ’ (associated with the elastic structure through G’) as a function of strain amplitude. The yield stress is taken as the peak stress, and the strain at this point the yield strain (see Figure 2). Generally, this value fits somewhere within the yield zone and has been shown to give a more reliable measurement of the yield stress which correlates well with other methods.
Test frequency can sometimes affect the measured yield stress depending on the RelaxationWhen a constant strain is applied to a rubber compound, the force necessary to maintain that strain is not constant but decreases with time; this behavior is known as stress relaxation. The process responsible for stress relaxation can be physical or chemical, and under normal conditions, both will occur at the same time. relaxation behavior of the material under test. Lower frequencies will give a better indication of material properties at rest but will greatly increase the time of the test. Consequently, values between 0.1 and 10 Hz are commonly employed.
This application note shows methodology and data for a number of gel samples.
Experimental
- The following gel samples were evaluated - an associative polymer (HASE)-surfactant system, a hair gel and an aqueous solution of mannan/xanthan gum in water.
- Rotational rheometer measurements were made using a Kinexus rheometer with a Peltier plate cartridge and a cone and plate measuring system2, and utilizing standard pre-configured sequences in rSpace software.
- A standard loading sequence was used to ensure that the samples were subject to a consistent and controllable loading protocol.
- A strain controlled amplitude sweep at 1 Hz was performed, and data for the modulus and elastic stress as a function of applied strain was measured.
- The yield stress for each sample was determined from a peak analysis of the elastic stress versus strain data.
- All rheology measurements were performed at 25°C.
Results and Discussion
Figure 3 shows the results from the strain amplitude sweeps for the diffferent samples, and Table 1 shows the corresponding values of yield stress and strain as determined from an automatic peak analysis.
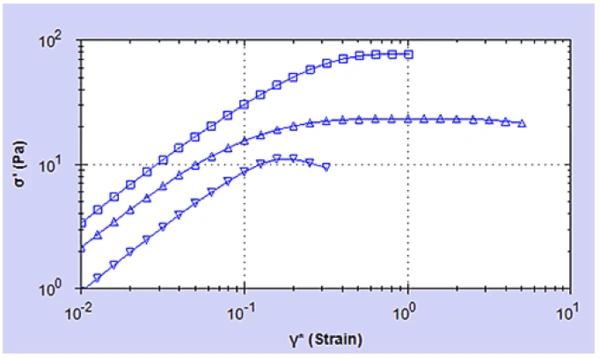
Table 1: Values of yield stress and strain determined from analysis of the elastic stress plots
| Sample Description | Yield Strain | Yield StressYield stress is defined as the stress below which no flow occurs; literally behaves like a weak solid at rest and a liquid when yielded.Yield Stress (Pa) |
|---|---|---|
| Hair gel | 0.869 | 77.3 |
| Xanthan gum/Mannan | 1.472 | 23.4 |
| HASE-surfactant | 0.194 | 11.1 |
The hair gel has the highest yield stress with a measured value of 77 Pa. The gum complex gave a yield stress of 23 Pa while the associative thickener had the lowest value of 11 Pa.
In terms of yield strain, the highest value was measured for the gum complex with a value of 1.5, thus indicating a more ductile structure. The hair gel gave a value of 0.87 and the associative thickener (HASE-surfactant) a value of 0.2 indicating a more brittle structure.
Conclusion
An oscillation amplitude sweep test can be used to determine the yield stress and strain of a material. The preferred test method involves monitoring the elastic stress σ’ as a function of strain amplitude γ with the yield stress inferred to be the measured peak value of σ’. This test has been used to measure the yield stress and strain of a number of aqueous gel systems.
2Please note that a parallel plate geometry can also be used – with this geometry being preferred for dispersions and emulsions with large particle sizes. Such material types may also require the use of serrated or roughened geometries to avoid artefacts relating to slippage at the geometry surface.