Introduction
Epoxy resins are versatile thermosetting polymers that are extensively used in coatings, structural adhesives, and fiber-reinforced composite materials. They cure through chemically initiated polymerization and Curing (Crosslinking Reactions)Literally translated, the term “crosslinking“ means “cross networking”. In the chemical context, it is used for reactions in which molecules are linked together by introducing covalent bonds and forming three-dimensional networks.crosslinking reactions. The Degree of CureThe degree of curing describes the conversion achieved during crosslinking reactions (curing). degree of cure has a significant effect on the thermal, mechanical, and chemical properties of the material. Therefore, precise control of the Curing (Crosslinking Reactions)Literally translated, the term “crosslinking“ means “cross networking”. In the chemical context, it is used for reactions in which molecules are linked together by introducing covalent bonds and forming three-dimensional networks.curing conditions is essential to optimizing performance, minimizing defects, and ensuring efficient production.
Dielectric Analysis
Dielectric Analysis (DEA) is a highly sensitive method for monitoring the Curing (Crosslinking Reactions)Literally translated, the term “crosslinking“ means “cross networking”. In the chemical context, it is used for reactions in which molecules are linked together by introducing covalent bonds and forming three-dimensional networks.curing state in real time. This application note presents the Curing (Crosslinking Reactions)Literally translated, the term “crosslinking“ means “cross networking”. In the chemical context, it is used for reactions in which molecules are linked together by introducing covalent bonds and forming three-dimensional networks.curing behavior of an epoxy resin at different heating rates using NETZSCH Dielectric Analysis (DEA) and the Kinetics Neo software for kinetic analysis, prediction, and process optimization.
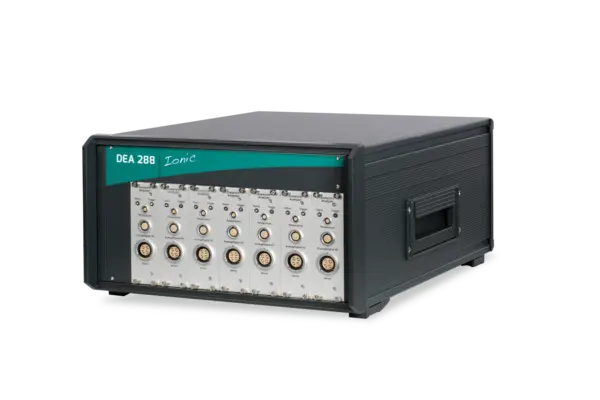
Figure 1 shows the instrument for Dielectric Analysis (DEA), which enables in-situ measurements of the Curing (Crosslinking Reactions)Literally translated, the term “crosslinking“ means “cross networking”. In the chemical context, it is used for reactions in which molecules are linked together by introducing covalent bonds and forming three-dimensional networks.curing behavior of various reactive materials. Multiple sensors allow for precise measurement of temperature, ensuring optimal performance and quality.
Measurement Conditions
The measurement conditions are listed in table 1.
Table 1: Measurement conditions
| Instrument | NETZSCH DEA 288 Ionic |
|---|---|
| Material | Epoxy resin |
| Heating rate | 1, 2 and 3 K/min |
| Sensor | Idex sensor |
| Frequency | 1 kHz |
Measurement Results and Discussion
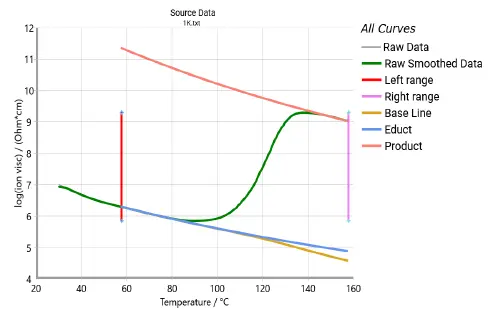
Figure 2 shows the typical experimental data curve at a heating rate of 1 K/min, obtained using the measurement parameters in table 1. The tangential baseline was applied. The initial decrease in Ionicviscosity is caused by the temperature dependence of the Ion ViscosityIon viscosity is the reciprocal value of the ion conductivity, which is calculated from the dielectric loss factor.ion viscosity during heating. The tangential (DEA Dynamic) baseline is temperature-dependent and calculated as exp(Eav/RT) assuming the Arrhenius activation energy, Eav, for the Ion ViscosityIon viscosity is the reciprocal value of the ion conductivity, which is calculated from the dielectric loss factor.ion viscosity. However, the baseline parameters are initially determined separately for reactants (left) and for products (right). The final baseline varies continuously between the reactant and the product baselines and is then subtracted from the measured data. As a result, the data for analysis appear horizontal both before and after the reaction (see figure 3).
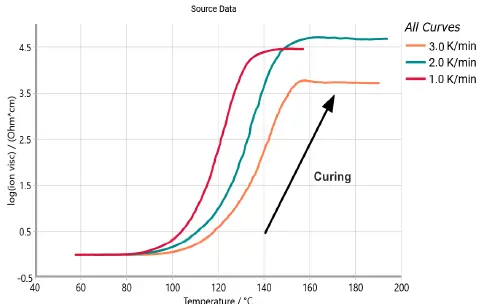
Figure 3 presents the experimental log (Ion ViscosityIon viscosity is the reciprocal value of the ion conductivity, which is calculated from the dielectric loss factor.ion viscosity) data for the epoxy resin cured at heating rates of 1, 2, and 3 K/min. The Ion ViscosityIon viscosity is the reciprocal value of the ion conductivity, which is calculated from the dielectric loss factor.ion viscosity increases sharply during Curing (Crosslinking Reactions)Literally translated, the term “crosslinking“ means “cross networking”. In the chemical context, it is used for reactions in which molecules are linked together by introducing covalent bonds and forming three-dimensional networks.curing, and higher heating rates shift the onset of Curing (Crosslinking Reactions)Literally translated, the term “crosslinking“ means “cross networking”. In the chemical context, it is used for reactions in which molecules are linked together by introducing covalent bonds and forming three-dimensional networks.curing to higher temperatures, resulting in different final viscosity values due to the temperature-dependence of the process.
Kinetic Analysis
Degree of Conversion (Cure)
The degree of conversion, α, is calculated by the Kinetics Neo software from the DEA measurement, where α ranges from 0 to 1. For heating measurements in thermal analysis, the conversion is apparently defined as the thermoanalytical effect at time, t, divided by the total thermoanalytical effect at the same point of time. For DEA, the definition of thermoanalytical conversion is as follows:
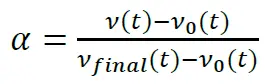
ν0(t) is the temperature-dependent baseline for Log (Ion ViscosityIon viscosity is the reciprocal value of the ion conductivity, which is calculated from the dielectric loss factor.ion viscosity) of the uncured reactant
νfinal(t) is the temperature-dependent baseline for Log (ion viscosity) for the cured material
ν(t) is the current ion viscosity at the point of time, t
Figure 4 presents the DEA measurement data for the epoxy resin at heating rates of 1, 2, and 3 K/min. A kinetic model was established using the Kinetics Neo software, with rhombus symbols indicating the experimental data and solid lines representing the fitted curves.
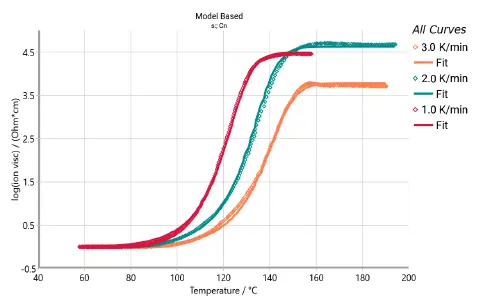
The kinetic parameters for the epoxy resin are detailed in table 2.
Table 2: Kinetic parameters for the epoxy resin
| Reaction step | A → B |
|---|---|
| Reaction type | Cn |
| Activation energy | 81.85 |
Log (pre-exponential factor [Log/ (1/s)] | 7.49 |
| Reaction order | 1.11 |
| Log (Autocat pre-exponential factor [Log(1/s)] | 0.67 |
| Contribution | 1 |
| Coefficient of determination (R²) | 0.9995 |
IsothermalTests at controlled and constant temperature are called isothermal.Isothermal Prediction
The kinetic model can now be applied to predict the Curing (Crosslinking Reactions)Literally translated, the term “crosslinking“ means “cross networking”. In the chemical context, it is used for reactions in which molecules are linked together by introducing covalent bonds and forming three-dimensional networks.curing process as a function of time and temperature. Figure 5 exhibits the predicted degree of conversion for the Curing (Crosslinking Reactions)Literally translated, the term “crosslinking“ means “cross networking”. In the chemical context, it is used for reactions in which molecules are linked together by introducing covalent bonds and forming three-dimensional networks.curing of an epoxy resin under different IsothermalTests at controlled and constant temperature are called isothermal.isothermal conditions from 50°C to 150°C, illustrating the effect of temperature on the curing process. At lower temperatures, curing is slow, while higher temperatures accelerate the process; full conversion is achieved rapidly at 150°C within just 0.2 hours (table 3).
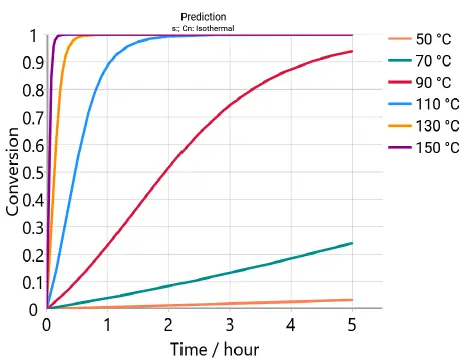
Table 3: Degree of CureThe degree of curing describes the conversion achieved during crosslinking reactions (curing). Degree of cure (α) vs. temperature
| Temperature (°C) | Time (Hours) | Degree of Conversion (α) |
|---|---|---|
| 50 | 5 | 0.033 |
| 90 | 5 | 0.939 |
| 150 | 5 | 1 |
Process Optimization
Figure 6(a) demonstrates that under a non-optimized temperature profile, the curing process reaches a conversion of 0.995 within 108 minutes. In contrast, figure 6(b) shows that with an optimized temperature profile, the same conversion level is achieved much faster, within just 45 minutes at a conversion rate of 2%/min, which reduces the curing time by approximately 58.3%. The optimized temperature profile contains two heating segments followed by isotherms, which is typical for an industrial curing process.
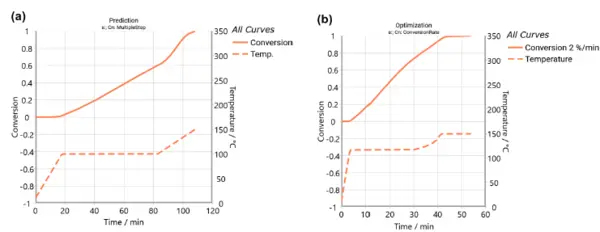
(b) Optimized temperature profile (dashed line) and predicted degree of conversion (solid line) for the epoxy resin curing process.
Conclusion
Dielectric Analysis (DEA) with Kinetics Neo enables the precise, real-time monitoring and kinetic analysis of the curing of an epoxy resin, effectively determining kinetic parameters and predicting the Degree of CureThe degree of curing describes the conversion achieved during crosslinking reactions (curing). degree of cure under various conditions.
Temperature profiles predicted through simulation and calculated to maintain a constant conversion rate of 2%/min optimized the curing process. By refining these profiles, the total conversion time was reduced from 108 to 45 minutes, a reduction of approximately 58%.
Benefits of Kinetic Analysis
Process Optimization & Time Savings: Optimized temperature profiles reduce curing time and lower energy consumption.
Accurate Prediction of Curing Behavior: Provides reliable forecasts under different conditions, and reduces trial-and-error approach.