起源と応用
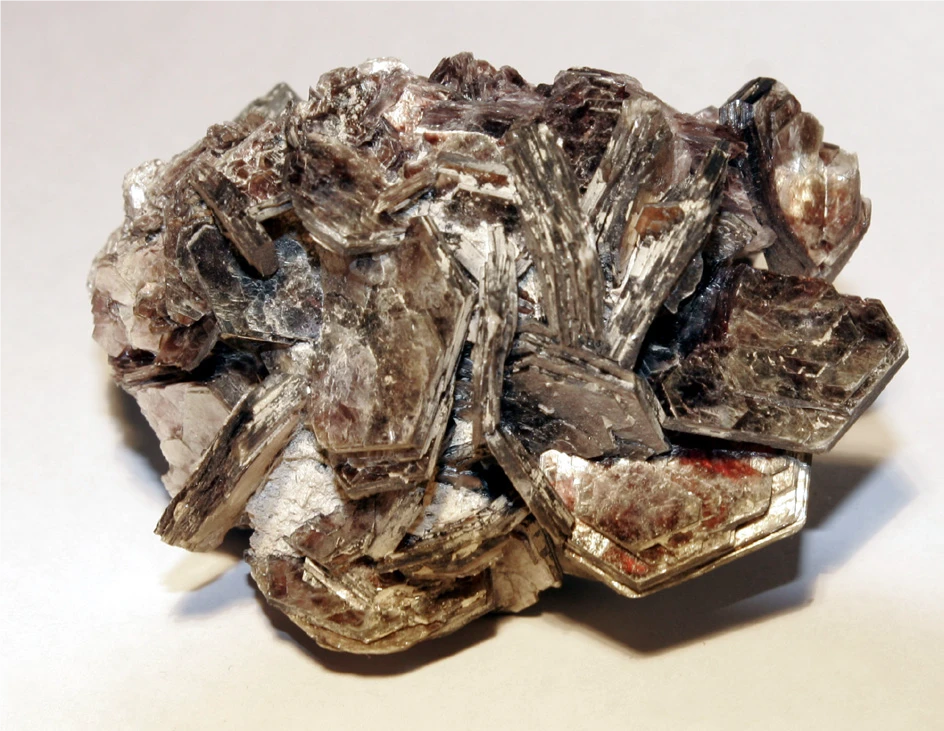
雲母片岩は有史以前から採掘されていた。マイカは、その層状構造により簡単に薄い板に割ることができるため、ガラスが工業的に生産される以前は、実際に窓ガラスに使用されていた。現在では、マイカは塗料や化粧品の顔料として使用されている。その優れた熱伝導率と電気絶縁性から、マイカのもう一つの重要な応用分野はエレクトロニクス産業であり、半導体部品の絶縁ディスクや超低損失コンデンサの誘電体として使用されている[1]。
構造
マイカは、シート状ケイ酸塩に属する鉱物グループの総称です。一般的な化学組成はDG2.3[T4O10]X2。1つの層は、角でつながったSiO2四面体(T=Siの場合)で形成され、もう1つの層はGO6八面体で構成される。各8面体層は、2つの4面体層の間に埋め込まれている。しかし、このT-O-T(四面体-八面体-四面体)層の並びは、電荷が中性ではない。電荷の等価化は、架橋層間アニオン(X)によって達成される[2]。
測定条件
- 装置
- TG 209 F1 Libra®
- 試料
- 雲母
- 試料質量
- 5.106 mg
- 容器
- Al2O3
- 雰囲気
- 窒素
- ガス流量
- 40ml/分
- 加熱速度
- 10K/分
熱重量測定
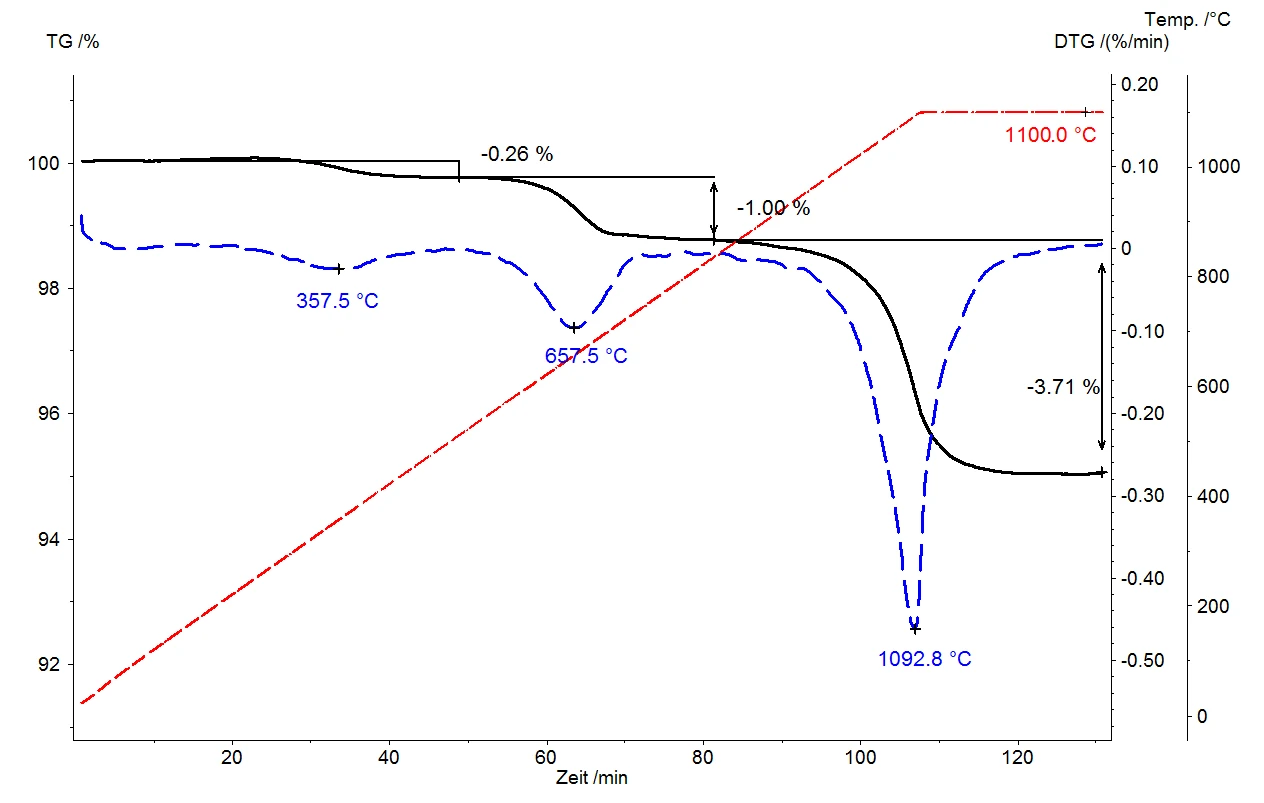
熱天秤は、無機物質の熱挙動の優れた特性評価を提供できる。試料組成の変化を連続的に記録し、さらに動的加熱速度(この例では10K/分)を使用することで、試料の発生を温度の関数として評価することができます。加熱速度は試料へのエネルギー供給の尺度であるため、必要な放出エネルギーおよび/または放出物質の結合エネルギーに関する結論を導き出すことができます。
ここで紹介する雲母試料の例では、357℃、657℃、1092℃の3つの質量減少ステップがよく分離しています。これらの質量減少ステップがよく分離しているため、様々な温度でのステップ評価により、試料から発生したガスの量を簡単に定量することができます。相対質量変化は、0.26%、1.00%、3.71%であった。放出温度は、吸着または結合の強さの指標であり、その値が高いほど、放出前の結晶表面へのガスの吸着または結晶構造への結合が強いことを意味する。試料が数秒で最高温度まで加熱され、すべてのガスが急激に放出される "フラッシュ熱分解 "とは対照的に、熱重量測定では加熱速度が非常に可変であり、動的セグメントと等温セグメントの組み合わせにより、ガス状分解生成物を温度の関数として、つまり段階的に放出することができる。雲母の例では、10K/minで試料を1100℃まで加熱しても、完全な分解反応を完結させるには不十分であり、もちろん定量化にも不十分であった。
実際、反応を完全に終了させるには、その後30分間の等温段階が必要であった。このような温度制御の柔軟性は、定量を容易にするだけでなく、熱重量測定プロセス中に試料から発生するガスの同定も可能にする。これに適しているのが「カップリング」と呼ばれる技術で、熱分析測定装置を質量分析やFT-IR分光法のような分光法の装置と結合させる。