Introduction
The Melt Flow Index (MFI, also designated MFR, melt flow rate) is a popular method of measuring the flowability of thermoplastic polymers under specific conditions. It determines the amount of a polymer melt flow through a standard die in 10 minutes under a specified temperature and load. The melt index test, MI, yields information about the flow behavior of polymer materials for shear rates that might not be relevant for processing (see our Application Note 329 [1]). A wide shear rate range flow curve obtained with the Rosand capillary rheometer provides theoretical support for the adverse behavior of polymer materials during processing, along with guidance for polymer material quality control and processing adjustment.
Imagine the following scenario:
Customer: I have several batches of polymer materials, and all the indicators in the factory quality control are consistent. The flow curve is the same, so flowability should be consistent. However, downstream customer feedback shows that there are problems during processing. Some batches of polymer can be normally blow-molded, while others showed serious blow breakage under the same blow molding conditions (temperature, pressure, air flow rate, etc.), causing serious inefficiency and waste.
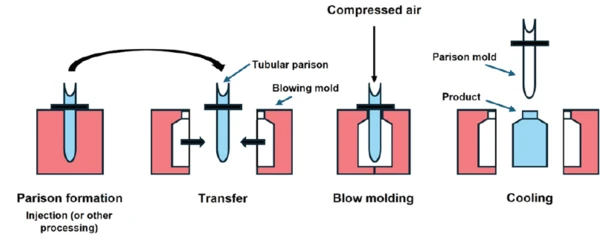
This is due to the blow molding process. The blow molding process consists of three basic steps as shown in figure 1:
- Parison formation: The raw material is processed into a molded parison (injection or extrusion), and then the parison is placed into a blow molding mold.
- Blow molding: Compressed air is injected into the parison to blow it tightly against the mold wall.
- Product cooling: The inflation pressure is maintained until the product cools and sets.
During the second blow molding step, the material exhibits tensile flow behavior rather than shear flow, so the shear viscosity flow curve could not be used to fully evaluate the blow molding behavior. Here, extension viscosity is needed.
Measurement Conditions – Cogswell-Model
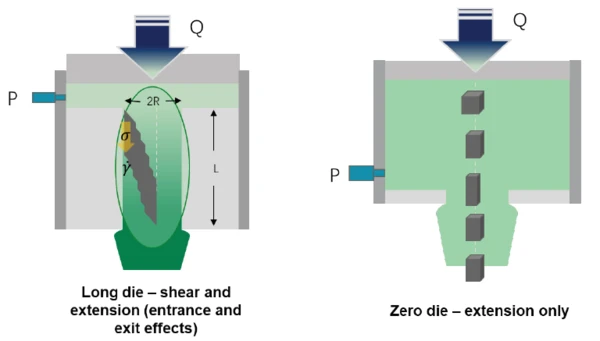
By means of our Rosand capillary rheometer, we can simultaneously obtain shear viscosity and tensile viscosity. When the polymer melt enters the long die, it is subjected to both shear and tensile forces, but when the melt enters the zero die, it is only subjected to tensile force as shown in figure 2. In that case, we can calculate the extension viscosity from both the long die and the zero die according to the Cogswell convergent flow model, which can be used to evaluate the stretching behavior during processing – including during blow molding, spinning and biaxial stretching film formation molding.
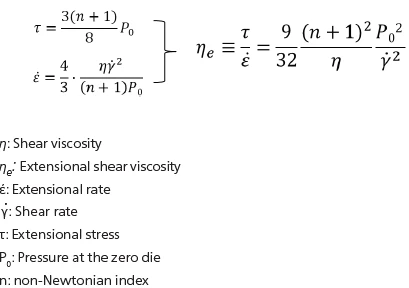
The Cogswell model is as follows:
An ABS granule sample (figure 3) was investigated under the measurement conditions detailed in table 1.
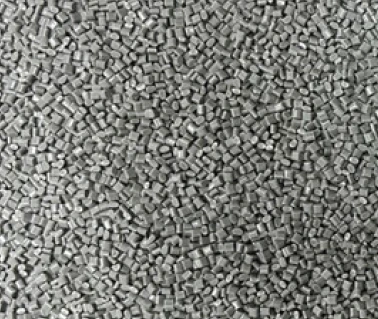
Table 1: Measurement conditions
| Instrument | Rosand twin-bore capillary rheometer |
| Sample | ABS (main component, modified ocmponents unknown) |
| Temperature | 210°C |
| Pressure sensor | 1000 psi (left); 5000 psi (right) |
| Die | 1:16 (left); 1:0.25 (right) |
| Test mode | Constant shear rate test, twin bore (use zero die to obtain extension viscosity) |
Measurement Results
With the NETZSCH Rosand twin-bore capillary rheometer, shear viscosity and extension viscosity can be simultaneously obtained. Figure 4 shows the common shear viscosity flow curve results for two different batches of ABS sample at 210°C. The shear viscosity curves are almost identical; the viscosity value at a specific shear rate is consistent, as is the Shear ThinningThe most common type of non-Newtonian behavior is shear thinning or pseudoplastic flow, where the fluid viscosity decreases with increasing shear.shear thinning degree. However, the two batches showed different blow molding capabilities. Batch #1 was prone to blowing breakage under the same processing conditions. In the shear viscosity flow curve, these two samples showed no difference. This is because blow molding is a form of processing that involves more stretching behavior. So, the common shear viscosity flow curve was not sufficient for fully evaluating this processing technology.
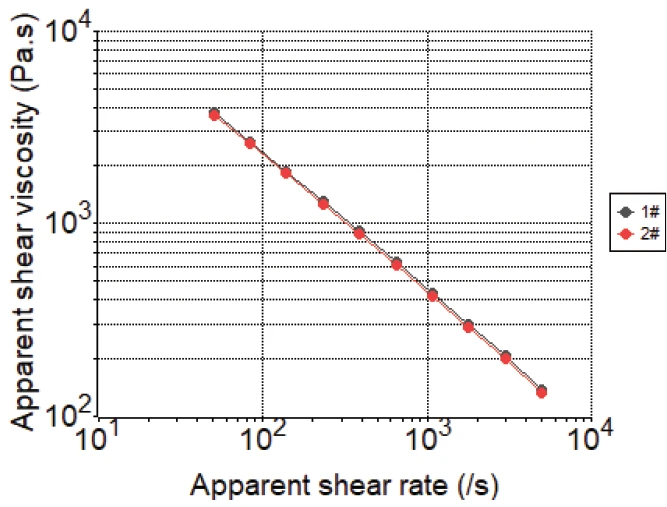
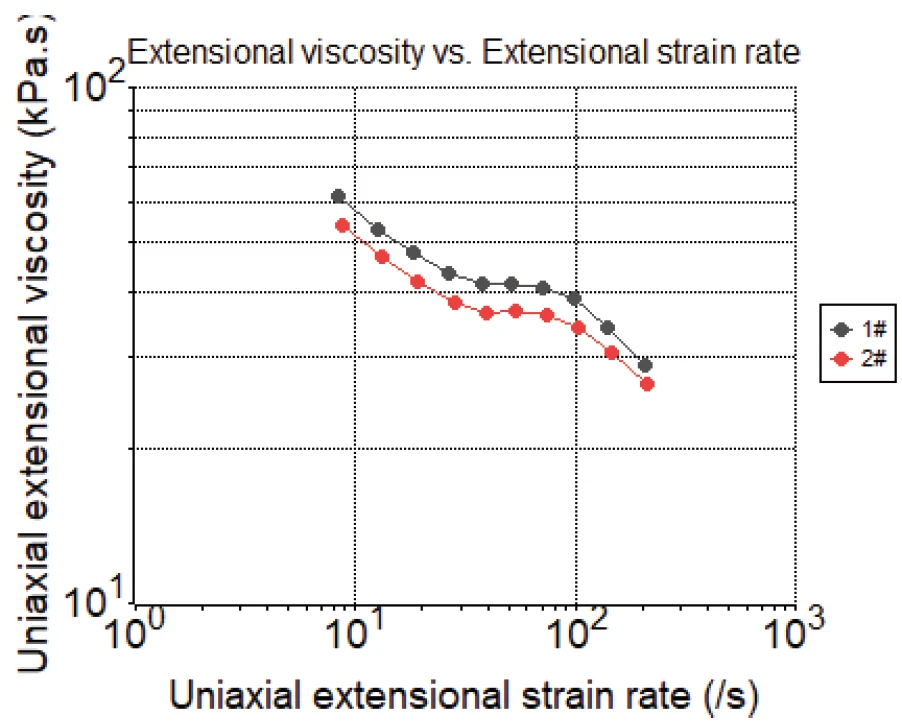
Figure 5 shows the extension viscosity flow curve results for two batches of the ABS sample at 210°C. Although the shear viscosity is totally the same, the extension viscosity showed a big difference. Sample #1 showed a higher overall extension viscosity than #2, and this is why #1 was prone to breakdown during blow molding. A higher extension viscosity makes the material more difficult to deform under the same conditions, which means the material is more elastic, and the elongation rate is worse. So, during the blow molding process, a poor elongation rate makes the material easy to break down. The difference between the extension viscosities could be affected by the different branching and CrystallizationCrystallization is the physical process of hardening during the formation and growth of crystals. During this process, heat of crystallization is released.crystallization behaviors (uniformity of inorganic fillers, which may affect the nucleation rate of polymers under the specific temperature, etc.) of the samples.
Conclusion
The shear viscosity flow curve sometimes cannot fully reflect the flow behavior of polymer materials during certain processing, if said processing includes stretching behavior such as blow molding, spinning or biaxial stretching film formation molding. The NETZSCH Rosand twin-bore capillary rheometer can provide shear and extension viscosity flow curves simultaneously in one test, and the extension viscosity can help evaluate the stretching behavior during these processes, thereupon providing guidance for polymer material quality control and processing adjustment.