A Practical Guide to Performing Measurements of the Payne and Mullins Effect with NETZSCH High-Force DMAs
Introduction
Elastomers frequently contain active fillers, such as Carbon BlackTemperature and atmosphere (purge gas) affect the mass change results. By changing the atmosphere from, e.g., nitrogen to air during the TGA measurement, separation and quantification of additives, e.g., carbon black, and the bulk polymer can become possible.carbon black or silica, to enhance their mechanical properties and attain the necessary quality for high-performance applications. In the case of high filler contents, a three-dimensional (3D) network of aggregated filler particles is formed. This results in a substantial increase in the sample’s stiffness. However, this microstructural feature is only stable as long as the applied deformations remain small, i.e., within the linear viscoelastic regime. Above this threshold, the 3D filler network breaks down and the moduli become a function of the applied StrainStrain describes a deformation of a material, which is loaded mechanically by an external force or stress. Rubber compounds show creep properties, if a static load is applied.strain or shear to the sample. This regime is referred to as the non-Linear Viscoelastic Region (LVER)In the LVER, applied stresses are insufficient to cause structural breakdown (yielding) of the structure and hence important micro-structural properties are being measured.linear viscoelastic region.
Two important effects are associated with this phenomenon: The Payne and the Mullins effect. While both are StrainStrain describes a deformation of a material, which is loaded mechanically by an external force or stress. Rubber compounds show creep properties, if a static load is applied.strain-softening phenomena and both effects depend on the deformation history, the former describes the decrease in storage modulus upon increasing dynamic deformations. The Mullins effect is commonly understood to be the change in the stress-strain curves for successive loading and unloading cycles performed in quasi-static tensile tests. In this case, the subsequent stress-strain curves will be situated below the initial loading cycle’s curve. The stress-strain curve of a sample will only match the stress-strain curve of a virgin sample once the previous maximum StrainStrain describes a deformation of a material, which is loaded mechanically by an external force or stress. Rubber compounds show creep properties, if a static load is applied.strain of the sample’s deformation history is exceeded.
It is important to note that these effects are not merely scientific curiosities. They are also relevant to real-life scenarios. Since elastomers are often exposed to high dynamic and static strains during service, this significantly impacts their performance in terms of stiffness and damping in comparison to the virgin elastomer material. To reliably quantify these changes during large deformations and/or dynamic loading, tests for the determination of the Payne and Mullins effect must be performed. Examples include windshield wiper blades, engine mounts and tires. Accurate quantification of the straininduced changes in the (dynamic)-mechanical properties enables reliable feedback during the research & development of new rubber compounds as well as simulation of the performance of the product in service.
The Payne effect is the reversible decrease in storage modulus of filled elastomers with increasing dynamic StrainStrain describes a deformation of a material, which is loaded mechanically by an external force or stress. Rubber compounds show creep properties, if a static load is applied.strain amplitude.
Mullins EffectThe Mullins effect describes a phenomenon typical for rubber materials.Mullins Effect:
The Mullins effect is the irreversible StressStress is defined as a level of force applied on a sample with a well-defined cross section. (Stress = force/area). Samples having a circular or rectangular cross section can be compressed or stretched. Elastic materials like rubber can be stretched up to 5 to 10 times their original length.stress softening in elastomers after the first loading–unloading cycle.
General Aspects of Payne and Mullins Effect Measurements
In most cases, the Payne effect is usually performed as a StrainStrain describes a deformation of a material, which is loaded mechanically by an external force or stress. Rubber compounds show creep properties, if a static load is applied.strain sweep using a (double) shear sample holder. It should be noted that these experiments can also be taken in tensile mode [1] (typically only small dynamic amplitudes are possible, depending on the initial sample length) or compression mode [2].
Shear mode is the preferred option in dynamic-mechanical analyzers due to the realization of larger StrainStrain describes a deformation of a material, which is loaded mechanically by an external force or stress. Rubber compounds show creep properties, if a static load is applied.strain/shear amplitudes than those in tensile or compression set-ups.
To ensure precise determination of the shear moduli, the ISO 6721-6 standard stipulates the use of samples with a diameter (cylindrical shape) or height (cuboidal shape) of at least 4 times the thickness of the sample. This approach eliminates any potential bending effects, thus removing the need for any corrections. A second reason for shear mode is the idea of applying load conditions which are similar to the real application: Windshield wipers will show deformations caused by a combined shear-bending load of up ±90°. Tread compounds on the top surface of passenger tires as well as on truck tires will be sheared against the next layer located below the tread layer (“underground layer”) up to 200% or more.
Finally, measurements taken under shear load conditions offer the distinct benefit of eliminating the need for static components. Therefore, the Payne effect measured in this case is solely a function of the rising dynamic shear amplitudes. No static load is required to analyze the Payne effect.
On the other hand, the Mullins effect is caused by static loading processes at different deformation levels. The Mullins effect is typically examined in tensile mode. It is also possible to measure this effect in the same manner using compression or (double) shear sample holders.
In the following, a step-by-step guide to setting up a measurement of the Payne effect with the (double) shear sample holder is presented.
Step-by-Step Guide to Performing Payne Effect Measurements with the Double Shear Sample Holder
Customers can choose from among different options for shear sample holders: Double shear sample holders are available for samples with a maximum diameter/height of 8 mm, 10 mm, or 20 mm, and a specialized shear sample holder is available for thin strip-like samples. The latter does not require attachment of the samples to the steel cylinders.
In the following, the focus lies only on the preparation of a shear sample holder with a 10-mm diameter for the purpose of a Payne effect measurement. For this case, sample preparation kits (the insertion and the alignment tool) are also available to ease the sample preparation process when using an adhesive. Sample preparation is also possible via directly vulcanizing un-vulcanized “green” rubber to the steel cylinders using a heating press. To accomplish this, the non-crosslinked rubber must be poured between the prepared steel cylinders and subsequently vulcanized at the desired temperature. This provides the advantage of higher repeatability of the measurement results, due to the highest possible adhesion strength between the elastomer and metal, a more precise positioning of the elastomer between the cylinders, and a lack of adhesive residue.
a) Preparation of the elastomer disks
I. A cast rubber sheet of the desired thickness should be available.
II. A hand drilling machine with an appropriate cylindrical die tool is necessary for the next step.
III. Dip the lower part of the cylindrical die tool in a water soap solution. This helps reduce the friction between the tool and the rubber sheet during drilling, thus enabling a better cutting process.
IV. Slowly lower the can drill tool (recommended speed is only 20 to 40 revolutions per minute) until the rubber sample has been cut out. Repeat the process for the required number of samples.
V. Dry the remaining soap left on the samples.
b) Assembly of the entire shear sample
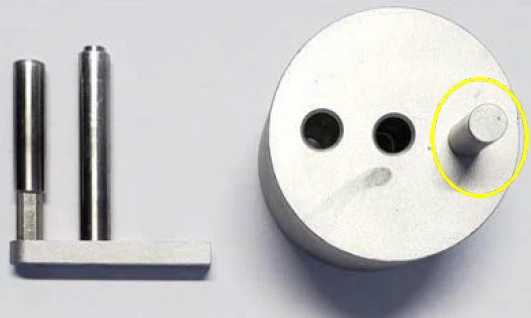
For preparation of the complete shear sample holder setup, it is necessary to have the following tools: An adhesive for gluing metal to the rubber material, e.g., a cyanoacrylate adhesive; three steel cylinders of 10-mm diameter; the cut-out elastomer disks; and the insertion tool kit that is shown in figure 1. Depending on the rubber material, a different adhesive may need to be chosen.
Furthermore, the rubber sample surfaces can be roughened with fine-grained sandpaper before the first assembly step. This might provide better adhesion during bonding
Subsequently, the elastomer sample surfaces need to be cleaned with a substance that does not alter the properties of the material and does volatilize quickly. A potential cleaner for this purpose is Loctite 7063.
I. First, measure the sample thickness and diameter of the two elastomer disks to be adhered with a caliper and write down the average value of both.
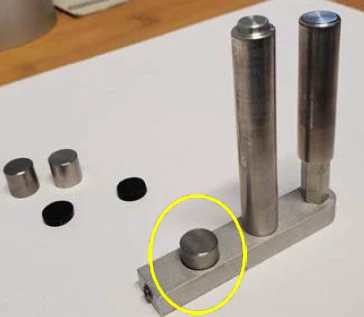
II. An elastomer sample disk needs to be adhered to one of the outer steel cylinders. To do this, place a steel cylinder into the depression of the insertion tool kit, as shown in figure 2, and tighten it with the grub screw.
III. Place an elastomer disk
IV. on the protruding cylindrical part of the lower portion of the insertion tool kit.
V. Apply a small drop of adhesive to the center of the rubber disc to be bonded to the steel cylinder. Spread the adhesive evenly over the surface. Bond the rubber disc to the clamped steel cylinder. Ensure the edges of the cylinder and disc are flush. Next, insert the entire assembly from figure 2 into the recesses in the steel block from figure 1. At this stage, the rubber disc will be in contact with the cylindrical elevation (the yellow ellipse in figure 1). Press down on the assembly in figure 2 from above with moderate force for 2–3 minutes. The adhesive bond should then be stable enough for the next step.
VI. Repeat these steps until the entire setup of steel cylinder – elastomer disk – steel cylinder – elastomer disk – steel cylinder is fabricated. Keep in mind to always apply the adhesive on the metallic surface to avoid fast Curing (Crosslinking Reactions)Literally translated, the term “crosslinking“ means “cross networking”. In the chemical context, it is used for reactions in which molecules are linked together by introducing covalent bonds and forming three-dimensional networks.curing of it on the elastomer surface.
VII. Let the adhesive cure for 24 h for the interfacial strength to reach its maximum. The Curing (Crosslinking Reactions)Literally translated, the term “crosslinking“ means “cross networking”. In the chemical context, it is used for reactions in which molecules are linked together by introducing covalent bonds and forming three-dimensional networks.curing process can be accelerated by placing the finished shear sample holder setup in an oven at temperatures ranging from 30°C to 70°C.
VIII. Any excess adhesive left on the outer surface should be removed by grinding with fine-grained sandpaper. This guarantees that no adhesive residue will influence the stiffness of the elastomer sample part during the shear experiment.
c) Preparation of the sample holder for the stiffness correction measurement
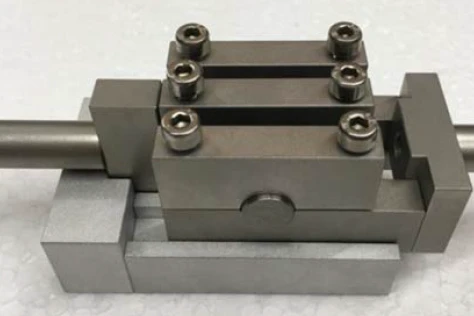
I. The alignment tool can be used to externally prepare the sample holder for the stiffness correction measurement with the steel cylinder (see figure 3).
II. Insert the steel cylinder used for the stiffness correction and tighten the screws with a fastening torque screwdriver and at least 1.5 Nm.
III. Insert and connect the entire sample holder setup to the static and dynamic force axes.
d) Preparation of the sample holder for sample measurement
First, unscrew the front parts holding the steel cylinder in place and take it out. Subsequently, position the prepared double shear sample as centrally as possible and secure it by screwing the front parts again.
e) Sample measurement definition with the Eplexor® 9 software
The same pan template file as for the sample holder correction measurement is chosen in this case, as the Payne effect is measured in static/dynamic sweep. Therefore, the following setting as shown in figure 4 is suitable. Here, the parameters for the dynamic oscillations are usually StrainStrain describes a deformation of a material, which is loaded mechanically by an external force or stress. Rubber compounds show creep properties, if a static load is applied.strain-controlled, rather than force-controlled. The measurement points distribution is chosen logarithmically as the measurement’s data plots are conventionally displayed with a logarithmic x-axis.
Note that the higher the maximum dynamic StrainStrain describes a deformation of a material, which is loaded mechanically by an external force or stress. Rubber compounds show creep properties, if a static load is applied.strain, the more likely it is that the adhesive at the interface between the elastomer and steel may break, thus invalidating any further runs. The maximum possible dynamic shear applied to the sample is limited by the maximum deformation of the carbon fiber-reinforced polymer blade spring.
Start the measurement via the “Load & Go” panel in the Eplexor® 9 software.

Results
In the following, the measurement results performed on an EPDM70 elastomer compound are presented. Both the Payne and Mullins effects were investigated.
a) Payne effect
The measurement parameters used for the measurement of the Mullins effect are summarized in table 1.
In figure 5, the viscoelastic quantities’ shear storage modulus, G’, and loss factor, tan δ, are shown as a function of the dynamic shear amplitude from 0.04% to 100%.
The tests were performed using different sweep types. Sweep type “up” means the dynamic amplitude will be swept from ±0.04% up to ±100%; “down” means from ±100% back to ±0.04%.
The initial curve represents the measured data for the virgin sample. At low shear values, i.e., in the linear viscoelastic regime for the undamaged elastomer compound, the shear storage modulus at 30°C is approx. 6 MPa. The end of the linear viscoelastic regime is already at a dynamic shear of 0.1%. From this point onwards, the material starts to soften due to the breakup of the filler-filler network. At a shear amplitude of 100%, G’ decreases to approx. 2 MPa – a value only 1/3 of the virgin state. Similarly, tan δ in the virgin state is approx. 0.1 and lies at about 0.135 for a dynamic shear of 100%. In between, a maximum in tan δ can be observed at approx. 4% that corresponds to a maximum in heat dissipation or damping for this rubber compound.
Table 1: Overview of the parameters used for the Payne effect measurements with the High-Force DMA
| Parameter | Value |
|---|---|
| Instrument | DMA 503 Eplexor® 500 N |
| Sample holder | Double shear sample holder Ø10 mm |
| Measurement mode | Shear |
| Active spring blades | Only CFRP spring blade |
| Sample dimensions | Ø10 mm × 1,6 mm (thickness up to 2.4 mm possible) |
| Atmosphere | Static air |
Static/Dynamic Sweep | |
| Temperature | 30°C |
| Frequency | 10 Hz |
| Contact force | 0 N |
| Static load type | Force-controlled |
| Target values | 0 N |
| Limit value | 30% |
| Dynamic load type | StrainStrain describes a deformation of a material, which is loaded mechanically by an external force or stress. Rubber compounds show creep properties, if a static load is applied.Strain-controlled |
| Target values | 0.04 ...100% (logarithmisc dstribution, 5 steps per decade) |
| Limit value | 500 N |
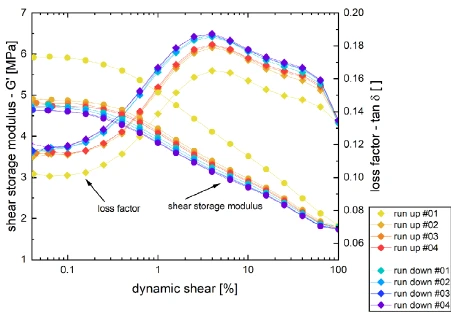
During the subsequent down-scans, clear hysteresis behavior from the initial up-scan can be observed. The storage modulus and loss factor are shifted to lower and higher values, respectively. Furthermore, the peak value in tan δ shifts slightly to lower dynamic shear amplitudes. This change is caused by the damage to the filler network incurred by the high dynamic shears imposed on the sample during the test.
Importantly, this damage and its consequences are also detected during the remaining up- and down-scans. The storage modulus and the loss factor remain at the same level from the first down-scan after the sample was dynamically loaded up to 100% shear for the first time.
b) Mullins effect
The measurement parameters used for the measurement of the Mullins effect are summarized in Table 2.
In Figure 6, the stress-strain diagrams of two different EPDM70 samples with all five load and unload cycles are shown. During these cycles, the non-linear viscoelastic and StrainStrain describes a deformation of a material, which is loaded mechanically by an external force or stress. Rubber compounds show creep properties, if a static load is applied.strain-softening behavior of the filled elastomer is apparent.
When the sample is loaded to a certain maximum StrainStrain describes a deformation of a material, which is loaded mechanically by an external force or stress. Rubber compounds show creep properties, if a static load is applied.strain value for the first time, it follows the initial curve. Upon unloading, there is a significant reduction in the StressStress is defined as a level of force applied on a sample with a well-defined cross section. (Stress = force/area). Samples having a circular or rectangular cross section can be compressed or stretched. Elastic materials like rubber can be stretched up to 5 to 10 times their original length.stress level for the same previous strain, leading to hysteresis in the StressStress is defined as a level of force applied on a sample with a well-defined cross section. (Stress = force/area). Samples having a circular or rectangular cross section can be compressed or stretched. Elastic materials like rubber can be stretched up to 5 to 10 times their original length.stress-strain diagram. At this point, it is not possible to distinguish between a purely viscoelastic phenomenon, as demonstrated in a previous Application Note [3] for a carbon-based aerogel, and additional damaging effects, such as the Mullins effect. The difference only becomes apparent with the second load cycle up to the same maximum strain value as in the previous cycle. If the StressStress is defined as a level of force applied on a sample with a well-defined cross section. (Stress = force/area). Samples having a circular or rectangular cross section can be compressed or stretched. Elastic materials like rubber can be stretched up to 5 to 10 times their original length.stress levels are lower for the second cycle than for the first cycle, then damage occurred. Once the maximum strain from the previous cycle is exceeded, the StressStress is defined as a level of force applied on a sample with a well-defined cross section. (Stress = force/area). Samples having a circular or rectangular cross section can be compressed or stretched. Elastic materials like rubber can be stretched up to 5 to 10 times their original length.stress-strain curve again follows the initial curve up to the new maximum strain of the current cycle.
Table 2: Overview of the parameters used for the Mullins effect measurements with the high-force DMA.
| Parameter | Value |
|---|---|
| Instrument | DMA 503 Eplexor® 500 N |
| Sample holder | Tension sample holder up to 700 N |
| Measurement mode | Tension |
| Active spring blades | All three spring blades |
| Sample dimensions | 2.34 mm × 2.58 mm × 20.67 mm 2.35 mm × 3.47 mm × 23.52 mm |
| Atmosphere | Static air |
Tensile Test | |
| Temperature | 30°C |
| Contact force | 2 N |
| Static load type | StrainStrain describes a deformation of a material, which is loaded mechanically by an external force or stress. Rubber compounds show creep properties, if a static load is applied.Strain-controlled |
| Target values | 30...0...60…0…90…0…120…0…150…0…180 % |
| StrainStrain describes a deformation of a material, which is loaded mechanically by an external force or stress. Rubber compounds show creep properties, if a static load is applied.Strain rate | 100%/min |
| Limit value | 150 N |

Relevance of the Payne and Mullins Effects in the Rubber Industry
Filled elastomers, regardless of whether with Carbon BlackTemperature and atmosphere (purge gas) affect the mass change results. By changing the atmosphere from, e.g., nitrogen to air during the TGA measurement, separation and quantification of additives, e.g., carbon black, and the bulk polymer can become possible.carbon black or silica, play a fundamental role in the rubber industry. As the Payne and Mullins effects manifest themselves as a change in the (dynamic) mechanical properties of filled elastomer materials, it is paramount to understand the implications on the properties of the product during service.
In multiple real-life applications, high dynamic deformations or multiple loading and unloading cycles occur during a product’s lifetime – this is the case, for example, with windshield wipers after several cycles, tires after several corners, or rubber dampers. These are hence subject to the consequences of the Payne and Mullins effects. This change in viscoelastic properties relates to different relevant properties such as the Rolling ResistanceThe rolling resistance is a force resisting the motion when a body is rolling across a surface. This determines the slip resistance of, e.g., car or truck tires.rolling resistance of tires via a change in the loss factor or the damping capability of bushings.
NETZSCH High-Force DMAs allow you to accurately quantify the extent of the Payne and Mullins effects in your material and thus to manufacture higher quality rubbers and better predict the performance of your final products.