Introduction
Oscillation measurements, which can be performed with the Kinexus rotational rheometer, are used to characterize the viscoelastic properties of materials, for example, soft solids like gels or pastes, or complex fluids such as polymers, emulsions, or suspensions. In these experiments, a sinusoidal shear deformation (StrainStrain describes a deformation of a material, which is loaded mechanically by an external force or stress. Rubber compounds show creep properties, if a static load is applied.strain-controlled) or shear StressStress is defined as a level of force applied on a sample with a well-defined cross section. (Stress = force/area). Samples having a circular or rectangular cross section can be compressed or stretched. Elastic materials like rubber can be stretched up to 5 to 10 times their original length.stress (StressStress is defined as a level of force applied on a sample with a well-defined cross section. (Stress = force/area). Samples having a circular or rectangular cross section can be compressed or stretched. Elastic materials like rubber can be stretched up to 5 to 10 times their original length.stress-controlled) is applied, and the material’s response is subsequently analyzed.
The main parameters obtained are:
- Storage shear modulus (G'), giving information about the “solid-like” behavior of a material.
- Loss shear modulus (G"), related to the “liquid-like” behavior of a material.
- Phase angle (δ): This parameter is indicative of the lag between the applied StressStress is defined as a level of force applied on a sample with a well-defined cross section. (Stress = force/area). Samples having a circular or rectangular cross section can be compressed or stretched. Elastic materials like rubber can be stretched up to 5 to 10 times their original length.stress and StrainStrain describes a deformation of a material, which is loaded mechanically by an external force or stress. Rubber compounds show creep properties, if a static load is applied.strain, thereby facilitating determination of the material’s behavior as either that of a solid (δ ≈ 0°) or that of a liquid (δ ≈ 90°).
Amplitude Sweep: Determination of the LVER (Linear Viscoelastic Region)
Oscillatory measurements are generally conducted within the Linear Viscoelastic Region (LVER)In the LVER, applied stresses are insufficient to cause structural breakdown (yielding) of the structure and hence important micro-structural properties are being measured.linear viscoelastic region (Linear Viscoelastic Region (LVER)In the LVER, applied stresses are insufficient to cause structural breakdown (yielding) of the structure and hence important micro-structural properties are being measured.LVER), where the material structure remains unaffected by the applied deformation. The Linear Viscoelastic Region (LVER)In the LVER, applied stresses are insufficient to cause structural breakdown (yielding) of the structure and hence important micro-structural properties are being measured.LVER is determined by means of an amplitude sweep. This test determines the maximum deformation amplitude that can be used without leading to a breakdown of the material’s structure for a defined frequency and temperature.
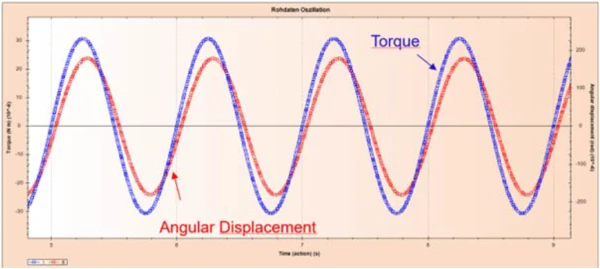
Within the Linear Viscoelastic Region (LVER)In the LVER, applied stresses are insufficient to cause structural breakdown (yielding) of the structure and hence important micro-structural properties are being measured.LVER, input and output oscillation frequencies are the same (see figure 1).
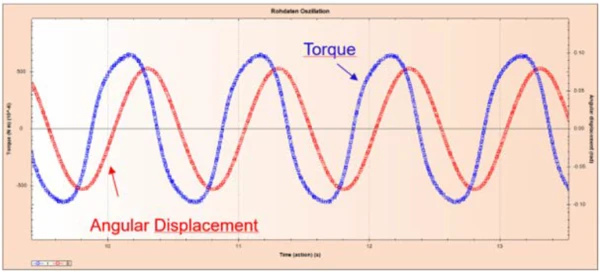
In contrast, beyond the Linear Viscoelastic Region (LVER)In the LVER, applied stresses are insufficient to cause structural breakdown (yielding) of the structure and hence important micro-structural properties are being measured.LVER, excitation with sinusoidal shear wave leads to a non-sinusoidal response (figure 2). The input oscillation (for example, with a base frequency of 1 Hz) breaks down to oscillations of different harmonic frequencies; see figure 3.

Harmonic distortion is defined as follows:

I1: Amplitude of the input frequency
In: Amplitude of the nth harmonic component of the oscillatory response
Harmonic distortion of 0% means perfect linearity of the signal. This parameter can be displayed in the Kinexus measurement and evaluation software, rSpace, to check the correctness of the oscillatory data.
Minimum of Harmonic Distortion (HD) = Best Signal-to-Noise Ratio
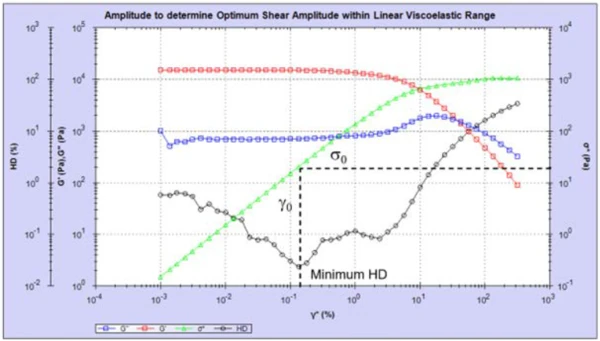
An example is depicted in figure 4: The curves of elastic shear modulus (G', red), viscous shear modulus (G'', blue), amplitude of shear StressStress is defined as a level of force applied on a sample with a well-defined cross section. (Stress = force/area). Samples having a circular or rectangular cross section can be compressed or stretched. Elastic materials like rubber can be stretched up to 5 to 10 times their original length.stress (σ, green), and harmonic distortion (HD, black) during an amplitude sweep. The shear StrainStrain describes a deformation of a material, which is loaded mechanically by an external force or stress. Rubber compounds show creep properties, if a static load is applied.strain, γ, detected at minimum HD corresponds to the deformation for an optimum signal-to-noise ratio. This value can be used for the following oscillatory measurements (frequency sweep, temperature sweep, etc.).
Harmonic Distortion to Check Linearity during Temperature or Frequency Ramps
The Linear Viscoelastic Region (LVER)In the LVER, applied stresses are insufficient to cause structural breakdown (yielding) of the structure and hence important micro-structural properties are being measured.linear viscoelastic region (Linear Viscoelastic Region (LVER)In the LVER, applied stresses are insufficient to cause structural breakdown (yielding) of the structure and hence important micro-structural properties are being measured.LVER) depends on measurement conditions such as frequency and temperature. In an amplitude sweep, these parameters are kept constant to determine the appropriate StrainStrain describes a deformation of a material, which is loaded mechanically by an external force or stress. Rubber compounds show creep properties, if a static load is applied.strain within the Linear Viscoelastic Region (LVER)In the LVER, applied stresses are insufficient to cause structural breakdown (yielding) of the structure and hence important micro-structural properties are being measured.LVER. During a frequency sweep, however, the frequency varies throughout the test, and the Linear Viscoelastic Region (LVER)In the LVER, applied stresses are insufficient to cause structural breakdown (yielding) of the structure and hence important micro-structural properties are being measured.LVER may change accordingly. To ensure that the material remains within the Linear Viscoelastic Region (LVER)In the LVER, applied stresses are insufficient to cause structural breakdown (yielding) of the structure and hence important micro-structural properties are being measured.LVER over the entire frequency range, the harmonic distortion signal can be monitored as an indicator of the linear behavior.
Conclusion
Harmonic distortion is an important signal to check if oscillations measurements are performed in the Linear Viscoelastic Region (LVER)In the LVER, applied stresses are insufficient to cause structural breakdown (yielding) of the structure and hence important micro-structural properties are being measured.linear viscoelastic region. It concerns the polymer field as well as the food and pharmaceutical field:
- Thermoplastics: Determining the Linear Viscoelastic Region (LVER)In the LVER, applied stresses are insufficient to cause structural breakdown (yielding) of the structure and hence important micro-structural properties are being measured.LVER is crucial for capturing only the intrinsic material properties during frequency or temperature sweeps of polymers and plastics. If measurements were taken outside the Linear Viscoelastic Region (LVER)In the LVER, applied stresses are insufficient to cause structural breakdown (yielding) of the structure and hence important micro-structural properties are being measured.LVER, additional structural changes such as chain orientation, disentanglements, or even damage to the polymer network could occur. This would lead to distorted measurement data and make the evaluation of processing or aging studies unreliable.
- Thermosets, coatings and adhesives: These systems often contain sensitive networks of polymers or fillers that can be destroyed under excessive StressStress is defined as a level of force applied on a sample with a well-defined cross section. (Stress = force/area). Samples having a circular or rectangular cross section can be compressed or stretched. Elastic materials like rubber can be stretched up to 5 to 10 times their original length.stress. If the LVER is not considered, the materials appear either too soft or too hard, which can lead to incorrect decisions in application and process design (e.g., incorrect viscosity windows for application or inaccurate predictions of adhesion).
- Food (e.g., gels, emulsions, spreadable fats): Here, it is particularly important not to destroy the fragile microstructure (e.g., emulsion networks, protein gels, fat crystals) by excessive shearing. Measurements outside the LVER could, for example, break up a gel or rearrange fat crystals, making the texture appear “artificially” softer than it actually is. This would have direct consequences for product development and quality control, as stability, mouthfeel, or spreadability would be incorrectly assessed.
- Pharmaceutical formulations (e.g., creams, pastes, suspensions): Here, too, structural integrity is key, especially when assessing storage stability or the release of active ingredients. If measurements are taken outside the LVER, shearing could alter the particle or carrier structures, leading to a misjudgment of the flow and application properties. In the worst case, this could have an impact on efficacy or patient safety.
The distortion factor ensures that rheological investigations are carried out in a range where the material structure remains intact. This prevents the measurement itself from distorting the result – a prerequisite for reliable, comparable, and practice-relevant data.