Why training on virgin data works: The natural grade-to-grade spread is larger than the shiftscaused by degradation
Recyclates, Degradation, and Why DSC is Suitable forIdentification
Recyclates inevitably carry a “processing and earlyservice” history. Thermal, thermo-oxidative, and mechanical stresses, along with environmental influences (temperature cycles, UV, chemicals), can induce chain scission, occasional branching or cross-linking, and shifts in molecular- weight distribution. Consequences include changes in melt flow and sometimes color/odor. For example, repeated extrusion may increase MFI in PP or HIPS due to chain scission, whereas in LDPE, cross-linking can dominate after many cycles and lower MFI. These degradation modes are well established in recycling literature. [1].
DSC remains suitable for identifying polymer families even when degradation occurs: For many polymers – especially polyolefins – the melting/CrystallizationCrystallization is the physical process of hardening during the formation and growth of crystals. During this process, heat of crystallization is released.crystallization fingerprint is comparatively robust under moderate reprocessing. The measurable degradation signal is typically smaller than the natural grade-to-grade variability within a family, which is the key context for interpreting the PP results below.
o address these challenges and enable robust, reproducible evaluation of polymer composition using DSC, Proteus® Now Quantify has been developed. This software uses machine learning-based models to derive precise compositions, qualities, and mixing ratios from DSC curves – even when samples exhibit realistic aging or degradation. This is based on comprehenisve and mixing ratios from DSC curves – even when samples exhibit realistic aging or degradation states. This is due to a comprehensive, carefully curated training data set and a specially developed approach to machine learning in the polymer environment.
Proteus® Now Quantify was trained using virgin materials and calibrated blends (known components, known mass fractions) because label quality is critical. Post-consumer or “degraded” datasets often have uncertain compositions (unknown blends, multilayers, legacy stabilizers, contamination).
Using these calibrated blend data captures the true family spread. This design choice allows models to generalize to realistically degraded samples without relying on potentially inaccurate degraded labels.
Key Takeaways: The use of ML models that have been trained using new material is justified, since they learn the wide range of qualities present in calibrated blend data. Typical shifts resulting from Decomposition reactionA decomposition reaction is a thermally induced reaction of a chemical compound forming solid and/or gaseous products. decomposition fall within the range of this variability.
How Degradation Manifests in DSC Using the Example of PP
The melting behavior of a polymer is influenced by its molecular weight and lamellar structure. Chain scission shortens polymer chains and tends to lower their Melting Temperatures and EnthalpiesThe enthalpy of fusion of a substance, also known as latent heat, is a measure of the energy input, typically heat, which is necessary to convert a substance from solid to liquid state. The melting point of a substance is the temperature at which it changes state from solid (crystalline) to liquid (isotropic melt).melting temperature (Tm). For PP, this decrease is typically 2 to 3°C between virgin and multiple-processed materials. While modest, this shift is still significant given the sensitivity of DSC.
Estela et al. [2] confirmed this by demonstrating that the melting endotherms of virgin versus reprocessed PP remain nearly identical in both peak position and enthalpy across multiple extrusion cycles. This indicates that the final crystal structure and degree of Crystallinity / Degree of CrystallinityCrystallinity refers to the degree of structural order of a solid. In a crystal, the arrangement of atoms or molecules is consistent and repetitive. Many materials such as glass ceramics and some polymers can be prepared in such a way as to produce a mixture of crystalline and amorphous regions.crystallinity are largely preserved, reflecting the stability of the molecular architecture under repeated thermal and mechanical StressStress is defined as a level of force applied on a sample with a well-defined cross section. (Stress = force/area). Samples having a circular or rectangular cross section can be compressed or stretched. Elastic materials like rubber can be stretched up to 5 to 10 times their original length.stress.
By contrast, the CrystallizationCrystallization is the physical process of hardening during the formation and growth of crystals. During this process, heat of crystallization is released.crystallization exotherms during cooling are more sensitive. Reprocessed PP shows subtle shifts in onset, CrystallizationCrystallization is the physical process of hardening during the formation and growth of crystals. During this process, heat of crystallization is released.crystallization temperature, and peak shape, consistent with changes in molecular-weight distribution and nucleation. These are consistent with changes in molecular weight distribution or nucleation, which was proven in their kinetics study using Kinetics Neo [2].
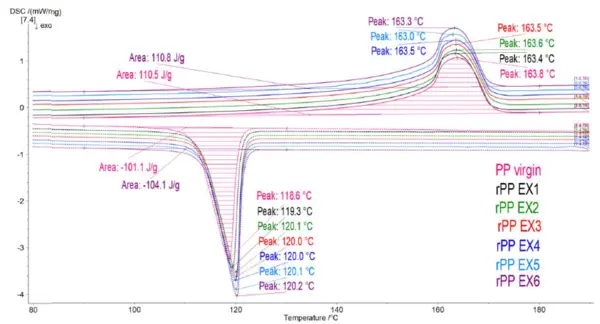
In Estela’s harshest processing conditions (extruder 250°C, 50 rpm), melting curves change little from virgin through 1–6× reprocessing, whereas cooling curves shift slightly to higher CrystallizationCrystallization is the physical process of hardening during the formation and growth of crystals. During this process, heat of crystallization is released.crystallization temperatures/onset. The largest change occurs from virgin → 1× → 2×; beyond that, additional shifts are minor in both viscosity and crystalli- zation and are more consistent with the material, approaching a lower bound in molecular weight/lamellar structure under these conditions. Once this quasi-plateau is reached, any further degradation either progresses too slowly or causes effects that are below the sensitivity of the DSC. The DSC results are summarized and replotted in figure 1.
Key Takeaways: PP reprocessing shows modest DSC effects in the range of a ~2 to 3°C lower Tm and only subtle shifts in the cooling exotherm. Also here, virgin-trained models are justified as they learn the broad grade spread from calibrated blend data; typical degradation shifts fall within that variability.
Grade-to-Grade Variability vs. Degradation (WhyVirgin Training Works)
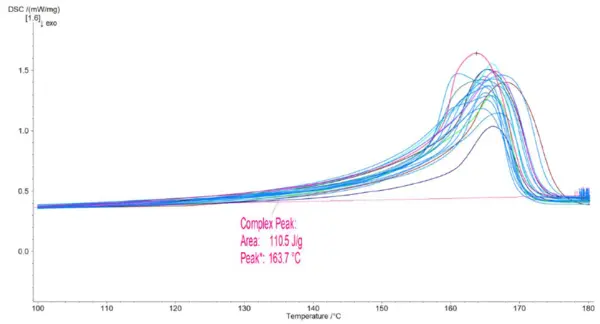
Placing PP reprocessing effects next to grade variability highlights the rationale behind our training strategy. In a large reference set from our Identify database (including >1200 polymer grades from KIMW database), PP grades show the Tm spanning from ~159.5 to 168.7°C and ΔHm ≈ 73 to 114 J/g – a range that is much wider than the ~2–3°C shift from reprocessing; even peak shapes vary across grades. Thus, a recycled PP often differs less from its own virgin counterpart than two unrelated virgin PP grades differ from each other. An excerpt of these datasets from Identify is shown in figure 2 in comparison to the virgin PP from figure 1.
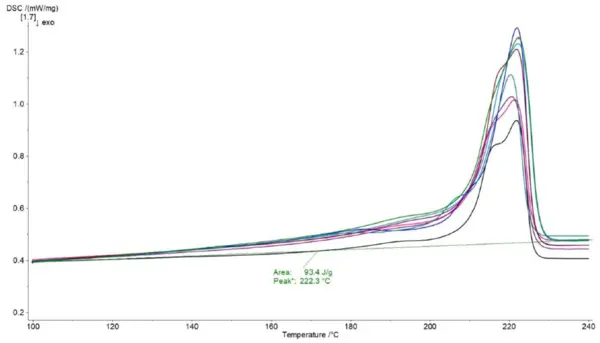
For polyamides, degradation effects are generally more pronounced. Literature reports show stronger shifts in thermal properties after multiple reprocessing steps because condensation polymers such as PA are especially sensitive to chain scission, moisture uptake, and hydro-lysis, which can alter Crystallinity / Degree of CrystallinityCrystallinity refers to the degree of structural order of a solid. In a crystal, the arrangement of atoms or molecules is consistent and repetitive. Many materials such as glass ceramics and some polymers can be prepared in such a way as to produce a mixture of crystalline and amorphous regions.crystallinity more substantially.
Yet even with these effects, the measured changes typically remain within the broad variability observed across PA6 grades. Figure 3 illustrates this grade variability among PA6 grades, with melting peaks between 215.2 and 223.8°C and melting enthalpies from ≈ 53 to ≈ 112 J/g (a spread of about 60 J/g).
Key Takeaway: Grade spread dominates: PP grade variability in Tm (~159.5 to 168.7°C) and ΔHm (≈ 73–114 J/g) exceeds the typical reprocessing shifts.
Conclusion
Understanding how recycling-induced degradation affects the DSC fingerprint is crucial for data-driven analysis. The new Proteus® Now Quantify software has been trained using curated datasets, covering the widest possible range of polymer grades and calibrated blends. This ensures the ML models capture both intrinsic grade variability and the smaller, but systematic shifts caused by degradation. With more than 1,500 datasets of mixed packaging polymers already included, Quantify Now continues to improve as additional reference data becomes available.
For transparency, we report an RMSE (Root Mean Square Error) per polymer class to summarize the model’s expected error for that class based on validation. Lower RMSE indicates higher expected accuracy of the model for that family. (This RMSE is a model-quality metric, not a per-sample confidence score.) Where application risk is high or the DSC signal is ambiguous, complementary methods – such as TGA, FTIR, or rheology – should be used alongside the Now Quantify result.