Introduction
Photopolymers are light-sensitive materials that polymerize upon exposure to light, transforming liquid monomers or oligomers into solid, functional networks. Their rapid and controllable Curing (Crosslinking Reactions)Literally translated, the term “crosslinking“ means “cross networking”. In the chemical context, it is used for reactions in which molecules are linked together by introducing covalent bonds and forming three-dimensional networks.curing process makes them suitable for applications such as inks, coatings, adhesives, and 3D printing.
Next-generation additive manufacturing (AM) processes, including multiphoton lithography and fusion jetting (FJ), exploit these materials to produce highresolution, complex geometries and multi-material parts [1]. In these processes, the Curing (Crosslinking Reactions)Literally translated, the term “crosslinking“ means “cross networking”. In the chemical context, it is used for reactions in which molecules are linked together by introducing covalent bonds and forming three-dimensional networks.curing behavior of acrylate photopolymers is strongly influenced by both UV light intensity and temperature, which significantly affect the Curing (Crosslinking Reactions)Literally translated, the term “crosslinking“ means “cross networking”. In the chemical context, it is used for reactions in which molecules are linked together by introducing covalent bonds and forming three-dimensional networks.curing rate and the final material properties. In AM processes, Curing (Crosslinking Reactions)Literally translated, the term “crosslinking“ means “cross networking”. In the chemical context, it is used for reactions in which molecules are linked together by introducing covalent bonds and forming three-dimensional networks.curing of material is done layer by layer with typical layer thicknesses around 50 to 100 μm [2,3].
The aim of this study is to investigate the Curing (Crosslinking Reactions)Literally translated, the term “crosslinking“ means “cross networking”. In the chemical context, it is used for reactions in which molecules are linked together by introducing covalent bonds and forming three-dimensional networks.curing kinetics of photopolymer diacrylates under different IsothermalTests at controlled and constant temperature are called isothermal.isothermal conditions and UV light intensities using dielectric analysis (DEA), and the Kinetics Neo software [7] for kinetic analysis, prediction, and process optimization.
Measurement Conditions
DEA measurements were performed using the DEA 288 Ionic (figure 1) under the measurement conditions listed in table 1. The DEA curves obtained are the basis for the kinetic analysis.
Multiple sensors allow for precise measurement of temperature, ensuring optimal performance and quality.
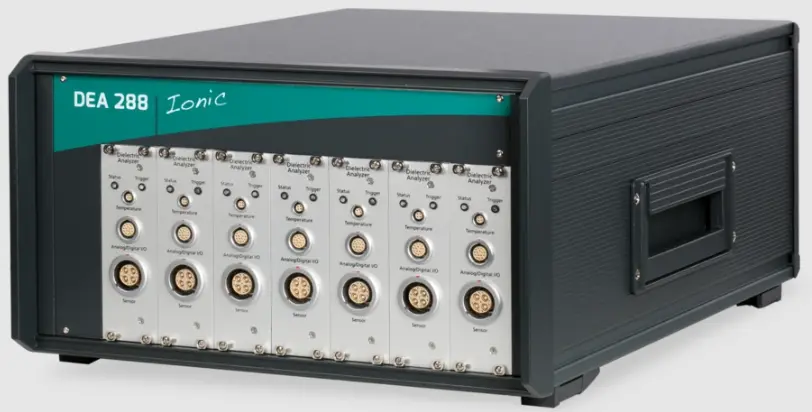
Table 1: Measurement conditions
| Instrument | NETZSCH DEA 288 Ionic |
|---|---|
| Material | Photopolymer diacrylates (UV DLP Firm) |
| IsothermalTests at controlled and constant temperature are called isothermal.Isothermal temperature/°C | 30, 90 and 150 |
UV intensities at 30°C/mW/cm² | 36, 75, 150 and 300 |
| Radiation time/min | 10 |
| Sensor | IDEX sensor |
| Frequency/Hz | 10 |
Measurement Results and Discussion
Figure 2 shows the typical experimental data curve at 150°C under UV light exposure with an intensity of 75 mW/cm2. The horizontal baseline is set to the data point at the left cursor where the light is switched on. The initial decrease in ion viscosity, caused by the temperature dependence of the Ion ViscosityIon viscosity is the reciprocal value of the ion conductivity, which is calculated from the dielectric loss factor.ion viscosity during heating, was removed by this baseline correction. Time t=0 is placed here at the point where the light is turned on. The Curing (Crosslinking Reactions)Literally translated, the term “crosslinking“ means “cross networking”. In the chemical context, it is used for reactions in which molecules are linked together by introducing covalent bonds and forming three-dimensional networks.curing process leads to an increasing Ion ViscosityIon viscosity is the reciprocal value of the ion conductivity, which is calculated from the dielectric loss factor.ion viscosity which is seen after starting the UV light exposure.
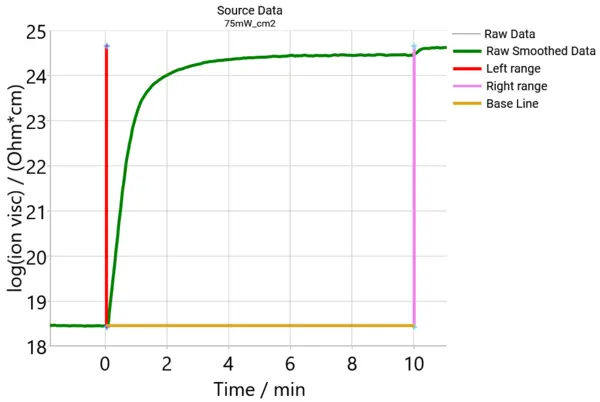
Figure 3 presents the set experimental measured data at the same UV intensity of 75 mW/cm2, but different temperatures. The Ion ViscosityIon viscosity is the reciprocal value of the ion conductivity, which is calculated from the dielectric loss factor.ion viscosity is temperature-dependent, and this is the reason for the different final experimental values at different temperatures. For a UV intensity of 75 mW/cm², Curing (Crosslinking Reactions)Literally translated, the term “crosslinking“ means “cross networking”. In the chemical context, it is used for reactions in which molecules are linked together by introducing covalent bonds and forming three-dimensional networks.curing is not fully completed after 8 minutes at IsothermalTests at controlled and constant temperature are called isothermal.isothermal temperatures of 30°C, 90°C, and 150°C, as the Ion ViscosityIon viscosity is the reciprocal value of the ion conductivity, which is calculated from the dielectric loss factor.ion viscosity continues to exhibit a slight increase.
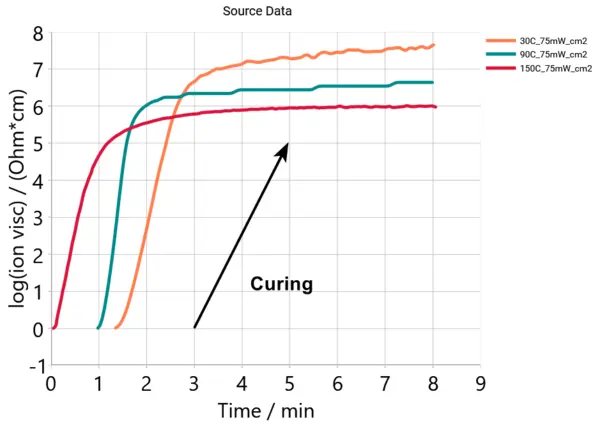
The measurement at the lowest temperature of 30°C shows a slower increase in the Ion ViscosityIon viscosity is the reciprocal value of the ion conductivity, which is calculated from the dielectric loss factor.ion viscosity curve than at 90°C because the Curing (Crosslinking Reactions)Literally translated, the term “crosslinking“ means “cross networking”. In the chemical context, it is used for reactions in which molecules are linked together by introducing covalent bonds and forming three-dimensional networks.curing rate decreases as temperature declines. The reaction at 150°C is a little slower than for 90°C because at high temperature, the termination step in radical polymerization becomes faster than the polymerizeration step. Our goal is to create a kinetic model that depends on both the temperature and the intensity of the UV light.
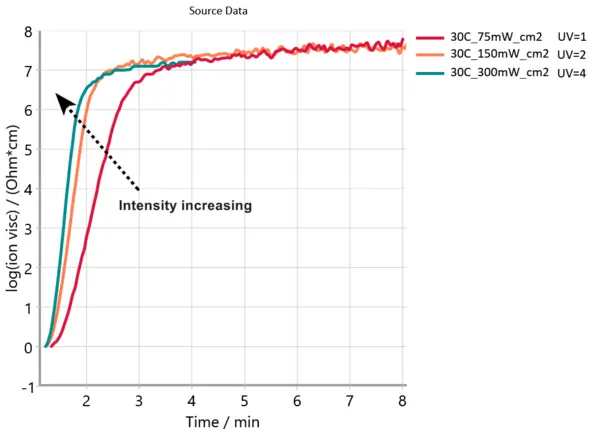
Figure 4 presents the set of DEA measurements at the same temperature of 30°C for UV intensities of 75, 150 and 300 mW/cm2. The ion viscosity increases from minimum ion viscosity, indicating the onset of Curing (Crosslinking Reactions)Literally translated, the term “crosslinking“ means “cross networking”. In the chemical context, it is used for reactions in which molecules are linked together by introducing covalent bonds and forming three-dimensional networks.curing. For all experimental curves, the ion viscosity continues to exhibit a slight increase after four minutes. This figure demonstrates fastest Curing (Crosslinking Reactions)Literally translated, the term “crosslinking“ means “cross networking”. In the chemical context, it is used for reactions in which molecules are linked together by introducing covalent bonds and forming three-dimensional networks.curing at the highest intensity of a UV light of 300 mW/cm2, the slowest intensity of a UV light of 75 mW/cm2 corresponds to the slowest curing rate.
Kinetic Analysis
Kinetics Neo software is used to create a unified model for different temperatures and intensities of UV light.
Degree of Conversion
The degree of conversion, α, is calculated by the Kinetics Neo software from the DEA measurement, where α ranges from 0 to 1. In thermal analysis for IsothermalTests at controlled and constant temperature are called isothermal.isothermal measurements, the conversion is operationally defined as the thermoanalytical effect observed at time, t, divided by the total thermoanalytical effect. For DEA, the definition of thermoanalytical conversion is as follows:
ν0 is the initial ion viscosity at the point of time where the UV light is switched on
νfinal is the final ion viscosity for the cured material
ν(t) is the current ion viscosity at the point of time, t
The reaction rate depends on the temperature, T, the UV intensity, I, and the reaction type, f(α):
Combined nth order and autocatalytic reaction model

where the weight factor, Kcat represents the pre-exponent of the autocatalytic reaction, and n and m are the reaction orders of the nth order reaction and the autocatalytic reaction, respectively [6].
Effect of UV Intensity on the Reaction Rate
The influence of UV intensity on the reaction kinetics was evaluated using a power-law dependence of the rate constant on light intensity [4,5]. The rate constant, k, can be expressed as (equation 4):
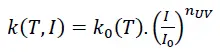
where k0(T) is the temperature-dependent kinetic constant, I/I0 is the relative UV intensity where a relative intensity of 1 corresponds in this case to I0 =75 mW/cm2, and nUV is a fitting parameter reflecting the sensitivity of the reaction rate to UV intensity.
Figure 5 illustrates the effects of temperature and UV intensity on the curing behavior of photopolymer diacrylates, measured by DEA (dielectric analysis). A common kinetic model was created using the Kinetics Neo software. The rhombus symbols represent the experimental data, and the solid lines correspond to the fitted curves. In the figure, UV = 1 corresponds to 75 mW/cm². The kinetics parameter are detailed in table 2.
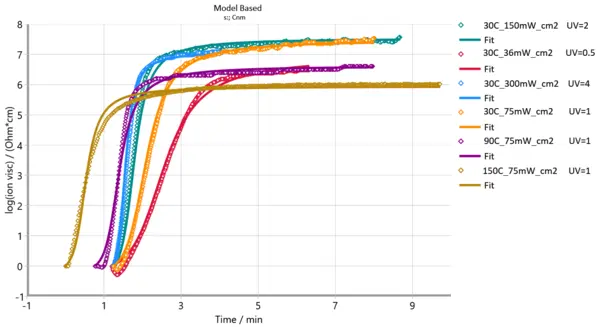
Table 2: Kinetic parameters of photopolymer acrylates based on DEA measurements
| Reaction step | A → B |
|---|---|
| Reaction type | Cnm |
| Activation energy [kJ/mol] | 5.174 |
| Log (pre-exponential factor) [Log (1/s)] | -1.793 |
| Reaction order | 1.724 |
| Log (Autocat pre-exponential factor [Log(1/s)] | 1.629 |
| AutcatPower mf | 1.136 |
| nUV Light | 0.619 |
| I0[mW/cm²] | 75 |
| Coefficient of determination (R²) | 0.996 |
Cnm: Reaction of nth order with m-power autocatalysis
The kinetic model can now be applied to predict results as a function of time, temperature, and relative intensity.
Figures 6 (a) and 6 (b) present the predicted degree of conversion of diacrylate photopolymers under IsothermalTests at controlled and constant temperature are called isothermal.isothermal conditions (20 to 120°C) at light intensities of 20 mW/cm² and 100 mW/cm².
At a UV intensity of 100 mW/cm², the final degree of conversion after 5 minutes ranges from 0.98 to 0.99. In contrast, at a UV intensity of 20 mW/cm², the final conversion after 5 minutes decreases, reaching values between 0.88 and 0.96.
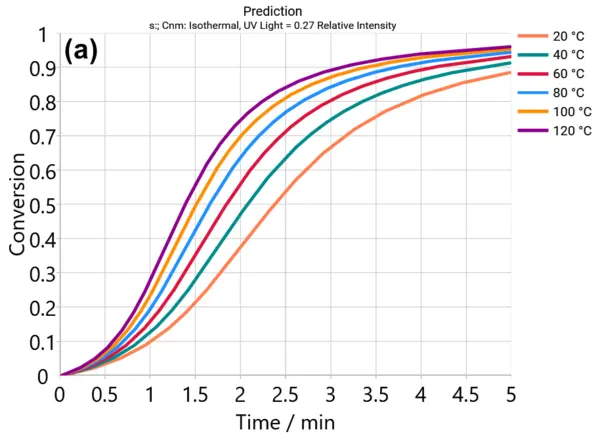
(a) intensity (20 mW/cm²)
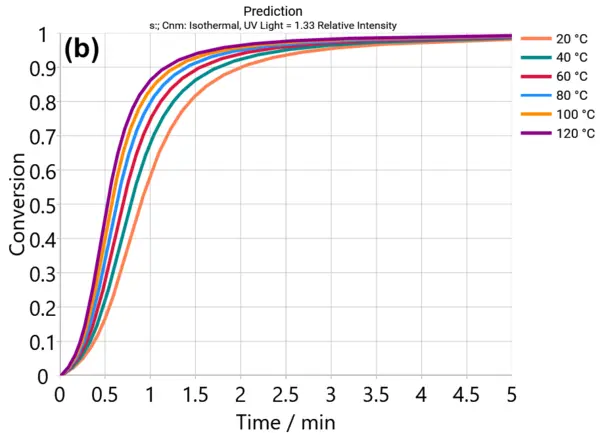
(b) intensity (100 mW/cm²).
Multi-Step Prediction (Sequence of Dynamic and IsothermalTests at controlled and constant temperature are called isothermal.Isothermal Segments)
Figure 7 shows the step prediction of the degree of conversion for diacrylate photopolymers at an intensity of 20 mW/cm² under multi-step conditions (dynamic and IsothermalTests at controlled and constant temperature are called isothermal.isothermal segments). Using this temperature program, outlined in table 3, the process can be optimized to achieve the desired degree of conversion more efficiently.
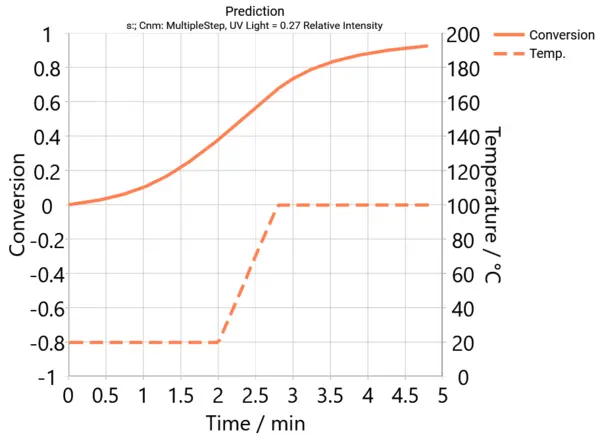
Table 3: Multi-step predictions
| Start T/°C | End T/°C | H.R./K/min | Time/min |
|---|---|---|---|
| 20 | 20 | 0 | 2 |
| 20 | 100 | 100 | 0.8 |
| 100 | 100 | 0 | 2 |
Conclusion
Dielectric Analysis (DEA) is an effective tool for monitoring UV photopolymers. It can be used not only in the laboratory but also directly on the production line. When combined with the Kinetics Neo software, DEA measurements have been proven to effectively determine kinetic parameters that are a function of both temperature and UV intensity. Termica Neo software adds significant value by simulating the thermal behavior of photopolymer layers, predicting temperature evolution, identifying potential hotspots, and enabling optimization of layer thickness and curing conditions.
Benefits of Kinetic Analysis and Thermal Simulation
Optimized Curing and Quality Control: Predict and achieve the desired Degree of CureThe degree of curing describes the conversion achieved during crosslinking reactions (curing). degree of cure, ensuring consistent material properties and reducing defects in 3D-printed or coated products.
Faster Development and Process Efficiency: Use kinetic models and simulations to shorten trial-and-error experiments, speeding up R&D and production setup for new photopolymer formulations or AM processes.
Application Note: Part 2
Find out more about: Thermal Simulation and Hotspot Identification in Photopolymer Layers Using Termica Neo Software in Part 2 of our Application Note