Introduction
As the demand for lithium-ion batteries continues to rise, driven by the growing adoption of electric vehicles and the integration of renewable energy sources, concerns have arisen regarding the availability and affordability of crucial raw materials. The escalating trend in raw material prices observed in recent years further underscores the pressing need to explore alternatives that capitalize on readily available and more uniformly distributed resources while maintaining comparable performance. In response to these challenges, researchers have actively explored diverse materials as potential alternatives to lithium-ion batteries [1]. We previously reported how thermoanalytical techniques can be valuable in supporting electrochemical energy storage research with regard to lithium-ion batteries [2, 3, 4] and here, we will show how they are capable of contributing to the investigation of emerging materials for batteries.
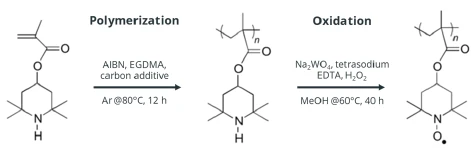
Particularly organic materials for batteries show promise due to their utilization of abundant and (potentially) renewable carbon-based compounds [5]. However, they are usually characterized by very low electronic conductivity that hinders their application as anodes and cathodes, since the supply of electrons is fundamental to the progression of electrochemical reactions. To overcome this issue, a substantial amount of conductive carbon is added to these compounds to enhance their conductivity. However, this carbon is an inactive compound (i.e., it does not store or release energy when charging or discharging the battery) and it decreases the achievable energy DensityThe mass density is defined as the ratio between mass and volume. density by reducing the weight fraction of active material available in the electrode. Hence, finding the optimal quantity of conductive carbon in organic electrodes is a fundamental challenge to improvement of their performance in batteries. In the specific case of this application note, a redox-active polymer (poly(2,2,6,6-tetramethyl-1-piperidinyloxy methacrylate, or PTMA) was synthesized with several carbon additives in varying weight ratios between the polymer and carbon (see figure 1 for a scheme of the synthesis) [6]. We then describe how thermogravimetric analysis was applied to quantify the actual amount of polymer and conductive carbon present in the sample, in order to check whether the planned ratio between these two components was conserved during the two-step synthesis process.
Measurement Conditions
The thermogravimetric analysis was performed with a TG 209 F1 Libra® . All the tests were performed at a heating rate of 5 K/min with a total gas flow of 40 ml/min. Alumina open crucibles (85 μl) were used, filled with 10 ± 0.010 mg of sample material. The samples were designated as follows (theoretical weight ratios):
- PTMA-GN15: 85% PTMA, 15% graphene nanoplates
- PTMA-SP15: 85% PTMA, 15% Carbon BlackTemperature and atmosphere (purge gas) affect the mass change results. By changing the atmosphere from, e.g., nitrogen to air during the TGA measurement, separation and quantification of additives, e.g., carbon black, and the bulk polymer can become possible.carbon black
- PTMA-MW15: 85% PTMA, 15% multi-walled carbon nanotubes
- PTMA-MW10: 90% PTMA, 10% multi-walled carbon nanotubes
- PTMA-MW5: 95% PTMA, 5% multi-walled carbon nanotubes
- PTMA-MW2.5: 97.5% PTMA, 2.5% multi-walled carbon nanotubes
Measurement Results
The synthesized batches underwent analysis via TG, employing a two-step protocol. Initially, PyrolysisPyrolysis is the thermal decomposition of organic compounds in an inert atmosphere.pyrolysis was conducted in an inert gas (N2) environment, reaching 800°C, succeeded by a cooling period. Subsequently, OxidationOxidation can describe different processes in the context of thermal analysis.oxidation took place in a mixture of 5%O2 and 95%N2, again reaching 800°C for samples containing multi-walled carbon nanotubes and 1000°C for the samples containing the other types of conductive additives. This was done to ensure complete combustion of the carbon, which was successfully achieved for each sample (see figures 2a and 2b for the trend of the temperature during the experiment and the related TG and DTG for each sample).
The PyrolysisPyrolysis is the thermal decomposition of organic compounds in an inert atmosphere.pyrolysis stage induces Decomposition reactionA decomposition reaction is a thermally induced reaction of a chemical compound forming solid and/or gaseous products. decomposition of the polymeric component with most Decomposition reactionA decomposition reaction is a thermally induced reaction of a chemical compound forming solid and/or gaseous products. decomposition by-products being gaseous and leaving the crucible. However, a minor portion of the polymer decomposes into PyrolysisPyrolysis is the thermal decomposition of organic compounds in an inert atmosphere.pyrolysis soot, characterized as carbon particles [7]. Consequently, the mass loss during PyrolysisPyrolysis is the thermal decomposition of organic compounds in an inert atmosphere.pyrolysis does not precisely reflect the polymer weight fraction, as a significant yet minor portion persists as a solid product. The subsequent OxidationOxidation can describe different processes in the context of thermal analysis.oxidation step is essential for elimination of the remaining carbon species, constituting a mixture of PyrolysisPyrolysis is the thermal decomposition of organic compounds in an inert atmosphere.pyrolysis soot and conductive carbon additive.
DTG during OxidationOxidation can describe different processes in the context of thermal analysis.oxidation revealed two peaks in certain samples (figures 2c and 2d). The lower-temperature peak is linked to the OxidationOxidation can describe different processes in the context of thermal analysis.oxidation of pyrolytic soot resulting from polymer PyrolysisPyrolysis is the thermal decomposition of organic compounds in an inert atmosphere.pyrolysis in the temperature range between ca. 400°C and 550°C, while the (eventual) second peak corresponds to the combustion of the conductive additive [7]. Measurement of the mass loss to the point where the absolute value of the DTG reached a minimum between the two peaks enabled estimation of the polymer quantity in the mixture by combining the mass loss from PyrolysisPyrolysis is the thermal decomposition of organic compounds in an inert atmosphere.pyrolysis and the OxidationOxidation can describe different processes in the context of thermal analysis.oxidation of pyrolytic soot.
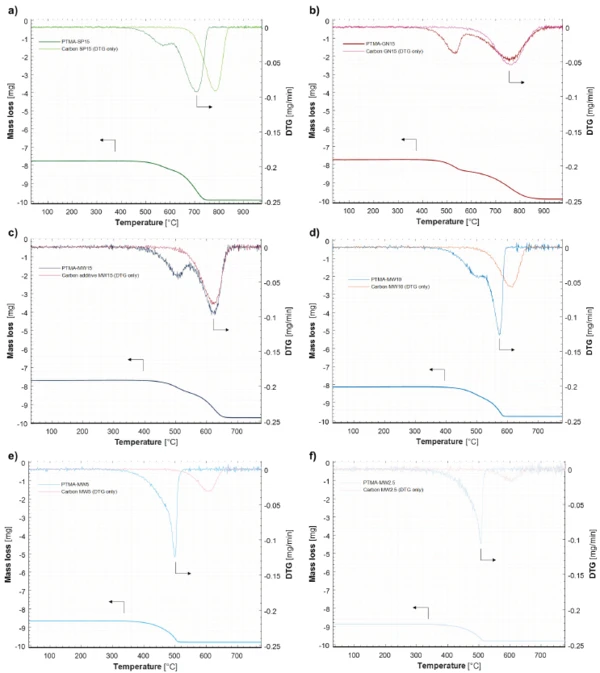
Along with the experiment on the PTMA-carbon samples, the conductive carbon additives themselves were the subject of TG experiments. Crucibles were loaded with the quantity of carbon additive expected in 10 mg of the respective polymer-carbon blend. For instance, for the PTMA-MW15 sample, 1.5 mg of additives were used in this experiment, which corresponds to a 15-% weight fraction in 10 mg of the polymer-carbon mixture.
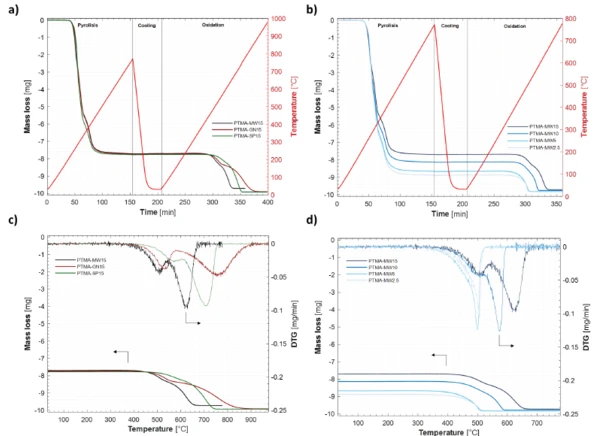
Figure 3 illustrates a comparison between the mass loss derivative during sample OxidationOxidation can describe different processes in the context of thermal analysis.oxidation and that of the corresponding carbon additive alone. Presentation of the mass loss on the y-axis as an absolute value instead of as a percentage is useful for checking whether the DTG peak at higher temperature observed in the PTMA-carbon samples aligns with the OxidationOxidation can describe different processes in the context of thermal analysis.oxidation peak of the respective carbon additives.
Notably, for PTMA-GN15 and PTMA-MW15, the second peak in sample OxidationOxidation can describe different processes in the context of thermal analysis.oxidation corresponded well to the carbon additive oxidation peak (see figures 3b and 3d). In the case of samples PTMA-SP15 and PTMA-MW10, the second oxidation peak occurred at a lower temperature than that of the carbon additive (figures 3a and 3d). This discrepancy may arise from the heat released during the preceding oxidation of the PyrolysisPyrolysis is the thermal decomposition of organic compounds in an inert atmosphere.pyrolysis soot, potentially lowering the activation energy for carbon additive oxidation, and suggesting an intimate contact between the polymer and the additive. Lastly, samples PTMA-MW5 and MW-2.5 lacked the second peak (figure 2d and figures 3e and 3f), making it impossible to differentiate between the two contributions. This may be due to the very low amount of conductive additive present in those samples (5% and 2.5%, respectively, in weight), the oxidation of which was drastically enhanced by the energy released by the combustion of the PyrolysisPyrolysis is the thermal decomposition of organic compounds in an inert atmosphere.pyrolysis soot formed by the polymer.
The results of the actual samples’ compositions are detailed in table 1. The actual sample composition is obtained by dividing the mass losses associated with the polymer and the carbon, as well as the residual mass in the crucible (residuals), by the initial amount of sample mass in the crucible (10 mg) and multiplying by 100 to obtain a percentage.
Table 1: Results of the actual samples' compositions
| Sample | Additive | Mass loss during PyrolysisPyrolysis is the thermal decomposition of organic compounds in an inert atmosphere.pyrolysis [mg] | Mass loss during oxidation related to polymer [mg] | Temperature @ DTG minium [°C] | Planned samplecompositiona | Actual samplecompositionb |
|---|---|---|---|---|---|---|
| PTMA-GN15 | Graphene nanoplates | 7.72 | 0.64 | 607 | 85/15 | 83.6/15.4/1.0 |
| PTMA-SP15 | Carbon black | 7.76 | 0.51 | 580 | 85/15 | 82.7/16.6/0.7 |
| PTMA-MW15 | Multi-walled carbon nanotubes | 7.69 | 0.67 | 543 | 85/15 | 83.5/13.5/3-0 |
| PTMA-MW10 | Multi-walled carbon nanotubes | 8.13 | 0.63 | 520 | 90/10 | 87.6/10.1/2.3 |
| PTMA-MW5 | Multi-walled carbon nanotubes | 8.67 | - | - | 95/5 | - |
| PTMA-MW2.5 | Multi-walled carbon nanotubes | 8.89 | - | - | 95.5/2.5 | - |
aPolymer/conductiveadditive weight ratio
bPolymer/conductive additive/impurities weight ratio
Conclusion
The thermogravimetric analysis confirmed the presence of a polymer part and a carbon part in the sample, and the residual mass at the end of oxidation indicated the quantity of non-volatile residuals present in the samples due to remainders of the synthesis process. These measurements allowed for calculation of an accurate composition of the powder samples. The weight fraction of PTMA resulting from the TG curves was about 1.5 to 2.5% lower than the theoretical one, probably due to a small fraction of non-polymerized monomer after the first synthesis step which was washed away during the product processing. Nevertheless, the planned composition was successfully obtained within a reasonable degree of accuracy, confirming the efficacy of the synthesis process chosen. Moreover, determination of the redox-active polymer weight fraction in the sample enabled accurate calculation of the capacity of the batteries built with the PTMA-carbon mixtures as cathodes.