Introduction
Differential Scanning Calorimetry (DSC, figure 1) is one of the most important tools in polymer characterization. It provides quantitative information about melting, CrystallizationCrystallization is the physical process of hardening during the formation and growth of crystals. During this process, heat of crystallization is released.crystallization, and Glass Transition TemperatureThe glass transition is one of the most important properties of amorphous and semi-crystalline materials, e.g., inorganic glasses, amorphous metals, polymers, pharmaceuticals and food ingredients, etc., and describes the temperature region where the mechanical properties of the materials change from hard and brittle to more soft, deformable or rubbery.glass transitions — making it well-suited to study polymer blends and recyclates. For mixtures, DSC can reveal how different polymers influence each other during CrystallizationCrystallization is the physical process of hardening during the formation and growth of crystals. During this process, heat of crystallization is released.crystallization or melting, and whether they remain distinct or form more complex structures.
The identification of polymers in DSC curves has long been possible using the NETZSCH Identify software, which matches unknown samples with a large reference database. However, quantification — determining how much of each component is present — is considerably more complex. Overlapping peaks, nucleation effects, or even co-CrystallizationCrystallization is the physical process of hardening during the formation and growth of crystals. During this process, heat of crystallization is released.crystallization can make it difficult to separate components or to quantify them with confidence.
This Application Note discusses typical scenarios encountered in polymer mixtures, shows how these effects appear in DSC, and introduces Proteus® Now Quantify – the first automated solution to support mixture quantification.
Cross-Contamination in Recyclates
Polymer recyclates, even with advanced sorting, nearly always contain other polymers. Adhesives, multilayer films, and residual coatings ensure that “pure” fractions are rare. These small amounts of contamination can alter CrystallizationCrystallization is the physical process of hardening during the formation and growth of crystals. During this process, heat of crystallization is released.crystallization behavior, cause phase separation, or reduce mechanical performance.
Small contaminations are particularly problematic for thin products such as films, where even minor phase separation can create visible defects, weak spots, or reduced barrier properties. In contrast, thicker parts like injectionmolded components can sometimes tolerate the same level of contamination with fewer obvious performance losses.
For the analyst, this means detecting and quantifying minor polymer fractions is essential to understanding recyclate quality.
Case Examples in Mixture Analysis
1. LDPE and PA6 – The Easy Case
LDPE and PA6 are often combined in multilayer packaging films, where LDPE provides sealability and moisture protection, while PA6 contributes mechanical strength and oxygen barrier performance. In recyclates, however, this combination is highly problematic because the two polymers are immiscible due to their different polarities.
From a DSC perspective, LDPE and PA6 are relatively easy to distinguish. They crystallize and melt in very different temperature ranges, and their Crystallinity / Degree of CrystallinityCrystallinity refers to the degree of structural order of a solid. In a crystal, the arrangement of atoms or molecules is consistent and repetitive. Many materials such as glass ceramics and some polymers can be prepared in such a way as to produce a mixture of crystalline and amorphous regions.crystallinity values differ significantly due to their distinct molecular structures and polarity. As a result, DSC curves show two clearly separated peaks, making identification straightforward. Quantification is reliable as long as good reference values for Crystallinity / Degree of CrystallinityCrystallinity refers to the degree of structural order of a solid. In a crystal, the arrangement of atoms or molecules is consistent and repetitive. Many materials such as glass ceramics and some polymers can be prepared in such a way as to produce a mixture of crystalline and amorphous regions.crystallinity are available to assign the correct enthalpy contribution to each component.
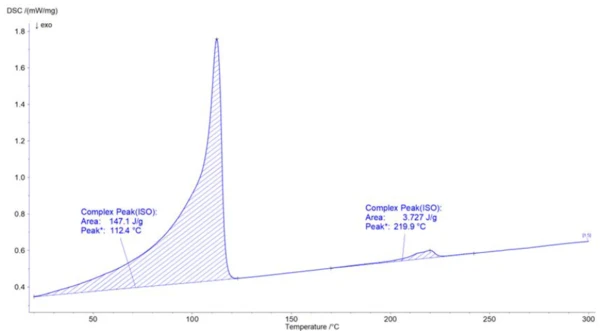
Figure 2 shows the DSC curve of a mixture of 96% LDPE and 4% PA6.
Composition Back-Calculation from DSC Enthalpy (Figure 1)
Given: Blend with LDPE + PA6.
Reference heats of fusion for 100% crystalline polymers:

Assumed crystallinities in the blend:
Xc,LDPE≈50%
Xc,PA6≈35%.
Measured enthalpy contribution (per gram of blend):
LDPE: ΔHm,LDPE=147.1 J/g
PA6: ΔHm,PA6 =3.727 J/g
Convert enthalpy to mass fractions (total = 1):
After testing several degrees of Crystallinity / Degree of CrystallinityCrystallinity refers to the degree of structural order of a solid. In a crystal, the arrangement of atoms or molecules is consistent and repetitive. Many materials such as glass ceramics and some polymers can be prepared in such a way as to produce a mixture of crystalline and amorphous regions.crystallinity, the combination that yielded a total close to 1 (ωLDPE + ωPA6 = 1.005) was 53% for LDPE and 34% for PA6.
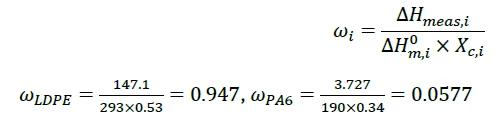
The back-calculated composition ≈ 95% LDPE and 5.7% PA6 are consistent with the nominal 96/4 blend.
2. LDPE and PP – The Hard case
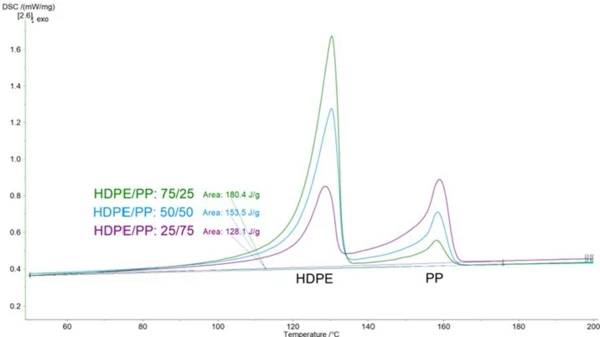
In HDPE/PP blends, the melting peaks are close enough to partially overlap, which complicates quantitative analysis. HDPE has a higher enthalpy of fusion (ΔHm⁰ ≈ 293 J/g) compared to PP (ΔHm⁰ ≈ 209 J/g), so the HDPE melting peak generally appears larger. As the PP content increases, the relative contribution of PP grows, but the overall enthalpy of both peaks decreases, reflecting the lower Crystallinity / Degree of CrystallinityCrystallinity refers to the degree of structural order of a solid. In a crystal, the arrangement of atoms or molecules is consistent and repetitive. Many materials such as glass ceramics and some polymers can be prepared in such a way as to produce a mixture of crystalline and amorphous regions.crystallinity potential of PP compared to HDPE, see figure 3. Following the example of LDPE and PA6 above, the crystallinities for HDPE are 68% and for PP are 51%. A semi-automated analysis using the DSC curve and the separation of enthalpies is possible using the Peak Separation software, which is explained in detail in our application note “NETZSCH Tools to Identify and Quantify Different Plastic Compositions in the Recycling Stream” [1].
From a CrystallizationCrystallization is the physical process of hardening during the formation and growth of crystals. During this process, heat of crystallization is released.crystallization perspective, the CrystallizationCrystallization is the physical process of hardening during the formation and growth of crystals. During this process, heat of crystallization is released. crystallization temperatures of PP and HDPE are close together. Depending on blend ratio and cooling rate, the two signals may overlap significantly, which was shown by Aumnate et al. [2]:
- At higher PP contents, the PP CrystallizationCrystallization is the physical process of hardening during the formation and growth of crystals. During this process, heat of crystallization is released. crystallization peak dominates the earlier temperature range, and the HDPE peak becomes smaller or partially masked.
- At higher HDPE contents, the HDPE CrystallizationCrystallization is the physical process of hardening during the formation and growth of crystals. During this process, heat of crystallization is released. crystallization peak is more pronounced, while PP still contributes to the higher-temperature side of the curve.
Key Takeaway: In HDPE/PP blends, the melting peaks overlap, and the quantification challenge lies in correctly separating the enthalpy contributions of the two polymers. With increasing PP content, the overall enthalpy decreases due to the lower Crystallinity / Degree of CrystallinityCrystallinity refers to the degree of structural order of a solid. In a crystal, the arrangement of atoms or molecules is consistent and repetitive. Many materials such as glass ceramics and some polymers can be prepared in such a way as to produce a mixture of crystalline and amorphous regions.crystallinity of PP compared to HDPE and due to the lower reference enthalpy of fusion of PP, even at the same theoretical Crystallinity / Degree of CrystallinityCrystallinity refers to the degree of structural order of a solid. In a crystal, the arrangement of atoms or molecules is consistent and repetitive. Many materials such as glass ceramics and some polymers can be prepared in such a way as to produce a mixture of crystalline and amorphous regions. degree of crystallinity.
3. HDPE-LLDPE and PA6-PA66 – The Extreme Case
Some mixtures are even more difficult because they co-crystallize or have nearly identical transition temperatures.
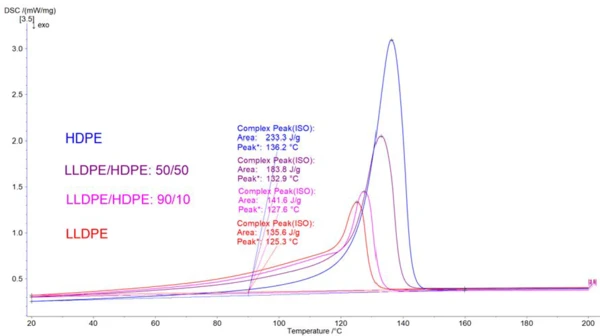
- HDPE–LLDPE blends: These often form mixed crystalline regions, leading to DSC curves with merged peaks. Quantification by peak separation alone is nearly impossible, and only differences in crystallinity can provide indirect evidence of both components, see figure 4.
- PA6–PA66 blends: Depending on the ratio, these two polyamides can crystallize together (at lower concentrations). The DSC then shows only one melting or CrystallizationCrystallization is the physical process of hardening during the formation and growth of crystals. During this process, heat of crystallization is released. crystallization peak, even though two polymers are present. At certain ratios, crystallinity differences may reveal the blend, but at others, the signal looks identical to a single polymer [3].
In both systems, even experienced users may be left uncertain. Crystallinity / Degree of CrystallinityCrystallinity refers to the degree of structural order of a solid. In a crystal, the arrangement of atoms or molecules is consistent and repetitive. Many materials such as glass ceramics and some polymers can be prepared in such a way as to produce a mixture of crystalline and amorphous regions.Crystallinity provides the only potential clue, but when co-CrystallizationCrystallization is the physical process of hardening during the formation and growth of crystals. During this process, heat of crystallization is released. crystallization is strong, even this can be inconclusive.
Figure 4 shows four DSC curves of pure LLDPE (135.6 J/g) and HDPE (233.3 J/g) as well as mixtures in ratios of 50/50 and 90/10. Using ΔHm⁰ = 293 J/g, the crystallinity is calculated as 46% and 80% for LLDPE and HDPE, respectively.
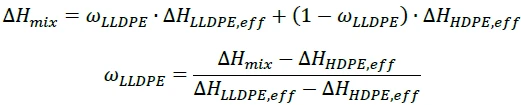
With these crystallinities, the mixing ratios can be back-calculated directly from the measured enthalpies using:
- Mixture 50/50 ((ΔHmix= 183.8 J/g)
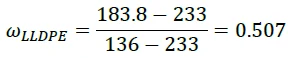
This is very close to the nominal 50/50 composition.
- Mixture 90/10 (ΔHmix= 141.6 J/g)
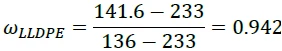
Again, the calculated ratio is close to the nominal 90/10 mixture.
However, in the case of recyclates, the crystallinity values are not known exactly and may vary within the literature ranges (LLDPE: 35 - 55%, HDPE: 60 - 80%). Assuming average crystallinities of 45% for LLDPE and 75% for HDPE already leads to much larger deviations:
| Mixture | ΔHmix [J/g] | Calculated LLDP [%] | Calculated HDPE [%] | Error LLDPE [%] | Error HDPE [%] |
| 50/50 | 183.8 | 40.9 | 59.1 | 9.1 | 9.1 |
| 90/10 | 141.6 | 88.9 | 11.1 | 1.1 | 1.1 |
Key Takeaway: Co-crystallizing systems like HDPE/LLDPE and PA6/PA66 represent the most extreme cases, where even crystallinity analysis may fail to provide a clear answer.
Proteus® Now Quantify – Automated Mixture Analysis
NETZSCH has developed Proteus® Now Quantify as the first automated DSC analysis software for polymer mixtures. The software is based on machine-learning models trained with curated mixture datasets. It can recognize hidden patterns and separate components even when the DSC curve appears to show only a single broad peak.
What makes this solution unique:
- It is the only automated DSC tool for mixture quantification on the market.
- It reduces reliance on expert interpretation for routine mixture analysis.
- It achieves a Root Mean Square Error (RMSE) between 1% (easy cases) and ~5% (extreme cases), meaning predicted compositions are typically within ±5% of the actual value.
For entry-level experts, this means: Now Quantify delivers reliable results without the need for years of experience in mixture interpretation. For advanced users, it provides a fast, reproducible check that confirms their interpretation or reveals subtle contributions they might otherwise miss.
Conclusion
DSC is a versatile tool for studying polymer blends and recyclates. While some mixtures like PET/HDPE are easy to quantify, more complex systems such as HDPE/LLDPE require detailed crystallinity evaluation, and in the most extreme cases such as PA6/PA66 co-crystallization, even crystallinity data may leave the result ambiguous.
While Identify has long enabled reliable identification of polymers via DSC, quantification has remained a much greater challenge. With Proteus® Now Quantify, NETZSCH introduces the only automated DSC solution for polymer mixture quantification. With an accuracy of about 5%, Now Quantify empowers even entry-level experts to confidently analyze unknown mixtures — while also supporting advanced analysts with fast, reproducible results.
By combining proven DSC technology with intelligent machine learning, NETZSCH enables a new level of efficiency, reliability, and accessibility in polymer mixture.
About IPT
The Institute for Polymer and Production Technologies gGmbH (IPT) in Wismar has been an independent research and development partner for the plastics industry since 1995. With its expertise in the fields of polymer analysis, recycling, and materials testing, IPT provides practical solutions for industrial challenges, from processing to product development. In the field of recyclates, the institute delivers valuable insights into structure-property relationships and supports the development of innovative applications.
Stefan Ofe is Head of Sales with a focus on material development and process optimization.
Christian Boss is a staff scientist with a focus on rheological and thermal material analysis and software development.