Introduction
Determination of the fiber volume content is essential for the evaluation of the mechanical and structural properties of fiber composites such as carbon or glassfiber composites. A standardized method is described in DIN 16459. First, the correction factor (Km) and the mass fractions of matrix (mM) and fibers (mFa) are determined by means of thermogravimetry (TGA). The fiber volume fraction can be calculated by considering the densities of the fiber material and the composite material.
The NETZSCH TG 309 Libra® can be used to determine almost all characteristic values needed. The use of an automatic sample changer significantly simplifies and fully automates the execution of the multiple measurements required. This not only saves time and personnel resources but also ensures higher reproducibility.
Experimental
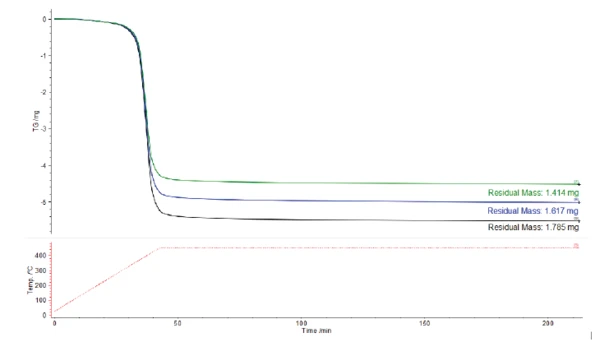
To determine the correction factor (Km), a triple determination was carried out on a pure matrix sample using thermogravimetry (NETZSCH TG 309 Libra®); see figure 1.
The measurement was carried out under identical conditions to the subsequent analysis of the composite material (see table 1).
Table 1: Measurement parameters for the TGA measurement
| Parameter | |
|---|---|
| Temperature program | RT - 450°C, 10 K/min Isotherm: 170 min |
| Gas atmosphere | N2, 100 ml/min |
| Crucible | Al2O3 (85 μl) |
Calculation of the correction factor (Km) is based on the ash residue (mAM) and the initial mass (mPM) of the pure matrix sample (see table 2).
Table 2: Calculated results for the correction factor (Km)
| mPM [mg] | mMA [mg] | Km [mg] | |
| 7.309 | 1.785 | 0.756 | |
| 6.631 | 1.617 | 0.756 | |
| 5.932 | 1.414 | 0.762 | |
| Mean value | 6.625 | 1.603 | 0.758 |
| Standard deviation | 0.562 | 0.151 | 0.002 |
A sample of the composite material was then also thermogravimetrically analyzed in triplicate (figure 2). The mass fractions of matrix (mM) and fibers (mFA) were determined from the initial mass (mPr), ash residue (mV) and the correction factor (see table 3).
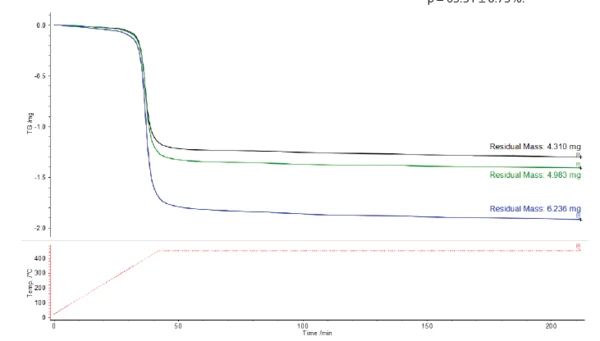
Table 3: Calculated results for the matrix mass (mM) and fiber mass (mFa), respectively
| mPr [mg] | mV [mg] | mM [mg] | mFa [mg} | |
| 5.611 | 4.310 | 1.716 | 3.894 | |
| 8.151 | 6.236 | 2.521 | 5.630 | |
| 6.389 | 4.983 | 1.859 | 4.530 | |
| Mean value | 6.717 | 5.177 | 2.032 | 4.685 |
| Standard deviation | 1.063 | 0.800 | 0.351 | 0.717 |
The densities of the fiber material and the composite material were used to calculate the fiber volume content. The fiber DensityThe mass density is defined as the ratio between mass and volume. density was taken from the data sheet (1.79 g/cm3), while the DensityThe mass density is defined as the ratio between mass and volume. density of the composite material was determined experimentally using Archimedes' principle (1.63 g/cm3).
The fiber volume content of the sample can now be calculated using the calculated characteristic values. For this sample, the fiber volume content is ρ = 63.51 ± 0.73%.
Conclusion
The NETZSCH TG 309 Libra® can be used to determine the fiber volume content of fiber-reinforced composites in accordance with DIN 16459. Several thermogravimetric analyses are carried out to determine a correction factor and the fiber and matrix masses. The fiber volume content can then be calculated based on the data obtained. This method offers decisive advantages for industry.
Comparatively, other methods exhibit some significant limitations. Optical methods such as microscopic image analysis are heavily dependent on the quality of sample preparation and only provide local results which are not necessarily representative. Chemical dissolution methods are often time-consuming and environmentally harmful, and can also affect the fibers. Imaging methods such as computer tomography are non-destructive, but cost-intensive and limited in their capacity for quantitative evaluation.
Overall, TGA offers a superior ratio of accuracy, reproducibility and efficiency. It enables precise and reproducible determination of the fiber volume content, which significantly improves quality assurance. The rapid analysis of small sample quantities allows efficient process monitoring and optimization. It also supports the development of new materials by providing precise information on material composition.
The automatic sample changer allows for the multiple measurements that are required for determining the fiber volume content to be carried out conveniently and without manual effort. This enables continuous automation of the analysis process, increases productivity in everyday laboratory work and at the same time, reduces the risk of operating errors – ideal for use in modern quality control and process optimization.
Acknowledgement
The samples were kindly provided by the Laboratory for Fiber Composite Technology at OTH Regensburg.