Introduction
Epoxy resin is a highly versatile and durable material widely recognized for its exceptional mechanical, thermal, and adhesive properties. Since its discovery, it has become a cornerstone of innovation across various industries due to its ability to withstand extreme environmental conditions, resist chemical damage, and provide structural strength.
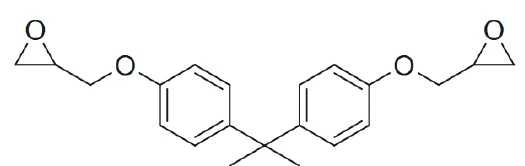
At the core of many epoxy resin formulations lies 2,2-bis(4-(2,3-epoxypropyl) phenyl) propane, commonly known as bisphenol A diglycidyl ether (formula in figure 1, BADGE). BADGE serves as a key component in the production of epoxy resins, offering excellent adhesive and anticorrosive properties.
Their production involves mixing an epoxy monomer with a hardener, which initiates a cross-linking reaction under controlled temperature, transforming the liquid resin into a solid 3D network.
During Curing (Crosslinking Reactions)Literally translated, the term “crosslinking“ means “cross networking”. In the chemical context, it is used for reactions in which molecules are linked together by introducing covalent bonds and forming three-dimensional networks.curing, two key transitions occur: gelation and vitrification. Gelation marks the irreversible transformation of the resin into a viscoelastic gel, associated with increased viscosity and stiffness, typically occurring at a Degree of CureThe degree of curing describes the conversion achieved during crosslinking reactions (curing). degree of cure between 55% and 80%. Vitrification happens when the resin reaches the Glass Transition TemperatureThe glass transition is one of the most important properties of amorphous and semi-crystalline materials, e.g., inorganic glasses, amorphous metals, polymers, pharmaceuticals and food ingredients, etc., and describes the temperature region where the mechanical properties of the materials change from hard and brittle to more soft, deformable or rubbery.glass transition temperature (Tg). At this point, the resin passes from a rubbery to a glassy state, yielding a slowdown or even a complete stop of the cure rate. Vitrification is reversible, and raising the temperature can restart the reaction. For these transitions, it is critical to ensure proper resin flow before gelation and to optimize the Curing (Crosslinking Reactions)Literally translated, the term “crosslinking“ means “cross networking”. In the chemical context, it is used for reactions in which molecules are linked together by introducing covalent bonds and forming three-dimensional networks.curing conditions for reaching a high Degree of CureThe degree of curing describes the conversion achieved during crosslinking reactions (curing). degree of cure.
This study proposes a method of creating Time-Temperature- Transformation (TTT) diagrams for epoxy resin systems by analyzing Curing (Crosslinking Reactions)Literally translated, the term “crosslinking“ means “cross networking”. In the chemical context, it is used for reactions in which molecules are linked together by introducing covalent bonds and forming three-dimensional networks.curing kinetics through nonisothermal temperature-modulated DSC and rheological measurements. This approach uses a two-step kinetic model to develop a TTT diagram, mapping the timing of gelation and vitrification during IsothermalTests at controlled and constant temperature are called isothermal.isothermal Curing (Crosslinking Reactions)Literally translated, the term “crosslinking“ means “cross networking”. In the chemical context, it is used for reactions in which molecules are linked together by introducing covalent bonds and forming three-dimensional networks.curing and thus aiding in optimizing Curing (Crosslinking Reactions)Literally translated, the term “crosslinking“ means “cross networking”. In the chemical context, it is used for reactions in which molecules are linked together by introducing covalent bonds and forming three-dimensional networks.curing parameters and reducing energy costs.
Materials: Epoxy Resin Composition and Mixing Ratio
The measurements were conducted on a commercial epoxy resin (Resoltech 1040T), composed of DGEBA (resin) and two diamines, 4,4'-methylenebis(cyclohexy lamine) and 3-aminomethyl-3,5,5-trimethylcyclohexylamine (hardener).
An epoxy mixture with a 1000:300 w/w resin-tohardener ratio was studied.
Instruments, Methods and Workflow
- Dependence of Glass Transition TemperatureThe glass transition is one of the most important properties of amorphous and semi-crystalline materials, e.g., inorganic glasses, amorphous metals, polymers, pharmaceuticals and food ingredients, etc., and describes the temperature region where the mechanical properties of the materials change from hard and brittle to more soft, deformable or rubbery.Glass Transition Temperature, Tg, on the Degree of CureThe degree of curing describes the conversion achieved during crosslinking reactions (curing). Degree of Cure: Tests for partially cured samples: Temperature-Modulated DSCTemperature-modulated DSC (TM-DSC) is used to separate multiple thermal effects that occur in the same temperature range and overlap in the DSC curve.Temperature-Modulated DSC (TM-DSC), analytical dependence; Di Benedetto’s equation: Kinetics Neo
- Kinetic Analysis and Kinetic Model: Tests at different heating rates: Differential Scanning Calorimetry (DSC). Kinetic modelling based on DSC tests and Tg dependence on the Degree of CureThe degree of curing describes the conversion achieved during crosslinking reactions (curing). degree of cure: Kinetics Neo
- Determination of Gel Point: IsothermalTests at controlled and constant temperature are called isothermal.Isothermal Tests (Rheology)
- Construction of Time-Temperature-Transformation (TTT) Diagram: Kinetics Neo
Dependence of Glass Transition Temperature, Tg, on the Degree of Cure
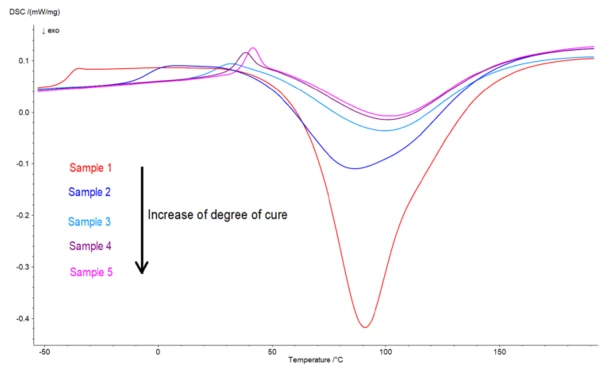
The dependence of the Glass Transition TemperatureThe glass transition is one of the most important properties of amorphous and semi-crystalline materials, e.g., inorganic glasses, amorphous metals, polymers, pharmaceuticals and food ingredients, etc., and describes the temperature region where the mechanical properties of the materials change from hard and brittle to more soft, deformable or rubbery.glass transition on the Degree of CureThe degree of curing describes the conversion achieved during crosslinking reactions (curing). degree of cure was investigated using the temperature-modulated DSC (NETZSCH DSC 214 with Autosampler).
Five samples were prepared in aluminum crucibles with a pierced lid and then partially cured at 20°C for different times to have different degrees of cure. These partially cured samples were tested by temperature-modulated DSC to separate the Glass Transition TemperatureThe glass transition is one of the most important properties of amorphous and semi-crystalline materials, e.g., inorganic glasses, amorphous metals, polymers, pharmaceuticals and food ingredients, etc., and describes the temperature region where the mechanical properties of the materials change from hard and brittle to more soft, deformable or rubbery.glass transition effect from the enthalpy RelaxationWhen a constant strain is applied to a rubber compound, the force necessary to maintain that strain is not constant but decreases with time; this behavior is known as stress relaxation. The process responsible for stress relaxation can be physical or chemical, and under normal conditions, both will occur at the same time. relaxation and the remaining curing.
TM-DSC tests were performed from -60°C to 200°C at a heating rate of 3 K/min with a 60 s modulation period and a 0.8 K temperature amplitude under nitrogen flow (40 ml/min).
The total heat flow from the temperature-modulated DSC tests is depicted in figure 2. The results show the residual curing for these samples. The Glass Transition TemperatureThe glass transition is one of the most important properties of amorphous and semi-crystalline materials, e.g., inorganic glasses, amorphous metals, polymers, pharmaceuticals and food ingredients, etc., and describes the temperature region where the mechanical properties of the materials change from hard and brittle to more soft, deformable or rubbery.glass transition temperature of the fully uncured sample 1 has the lowest value. The higher the initial Degree of CureThe degree of curing describes the conversion achieved during crosslinking reactions (curing). degree of cure, the lower the enthalpy of the ExothermicA sample transition or a reaction is exothermic if heat is generated.exothermal peak of residual curing. As long as the reaction progresses, the Glass Transition TemperatureThe glass transition is one of the most important properties of amorphous and semi-crystalline materials, e.g., inorganic glasses, amorphous metals, polymers, pharmaceuticals and food ingredients, etc., and describes the temperature region where the mechanical properties of the materials change from hard and brittle to more soft, deformable or rubbery.glass transition temperature increases, leading to its overlapping with the ExothermicA sample transition or a reaction is exothermic if heat is generated.exothermal curing peak for higher degrees of cure.
The Glass Transition TemperatureThe glass transition is one of the most important properties of amorphous and semi-crystalline materials, e.g., inorganic glasses, amorphous metals, polymers, pharmaceuticals and food ingredients, etc., and describes the temperature region where the mechanical properties of the materials change from hard and brittle to more soft, deformable or rubbery.glass transition temperature, Tg, from the reversing heat flow and the curing enthalpy from the non-reversing heat flow for each sample are detailed in table 1 along with the curing time as 20°C and the degree of cure, calculated from the residual enthalpy. The fully uncured sample 1 was completely cured during the first heating, where it has a Glass Transition TemperatureThe glass transition is one of the most important properties of amorphous and semi-crystalline materials, e.g., inorganic glasses, amorphous metals, polymers, pharmaceuticals and food ingredients, etc., and describes the temperature region where the mechanical properties of the materials change from hard and brittle to more soft, deformable or rubbery.glass transition temperature Tg0 [1]. Then it was heated a second time in order to determine the Glass Transition TemperatureThe glass transition is one of the most important properties of amorphous and semi-crystalline materials, e.g., inorganic glasses, amorphous metals, polymers, pharmaceuticals and food ingredients, etc., and describes the temperature region where the mechanical properties of the materials change from hard and brittle to more soft, deformable or rubbery.glass transition temperature (Tg∞) for the totally cured material (last line in table 1).
Table 1: Results of the temperature-modulated DSC measurements
| Sample | Curing time at 20°C [h] | Glass transition temperature [°C] | Enthalpy of rest curing [Jg-1] | [%] |
| 1 | 0 | -36.8 | 471 | 0 |
| 2 | 4.75 | -1.1 | 287 | 39 |
| 3 | 9.51 | 27.7 | 187 | 60 |
| 4 | 14.27 | 37.9 | 154 | 67 |
| 5 | 19.03 | 41.3 | 145 | 69 |
| 1st, 2nd heating | - | 126.1 | 0 | 100 |
The degree of cure of the samples 2 to 5 was determined by comparing the enthalpy of the curing peak to the enthalpy of the fully uncured sample.
Based on the measured values, summarized in table 1, a plot of the Glass Transition TemperatureThe glass transition is one of the most important properties of amorphous and semi-crystalline materials, e.g., inorganic glasses, amorphous metals, polymers, pharmaceuticals and food ingredients, etc., and describes the temperature region where the mechanical properties of the materials change from hard and brittle to more soft, deformable or rubbery.glass transition temperature versus degree of cure can be created by applying the DiBenedetto equation (2).

Tg0: Glass Transition TemperatureThe glass transition is one of the most important properties of amorphous and semi-crystalline materials, e.g., inorganic glasses, amorphous metals, polymers, pharmaceuticals and food ingredients, etc., and describes the temperature region where the mechanical properties of the materials change from hard and brittle to more soft, deformable or rubbery.glass transition temperature of the uncured resin
Tg∞: glass transition temperature of the fully cured resin
α: degree of cure
λ: fitting constant
Figure 3 depicts the glass transition temperatures as a function of the degree of cure gathered experimentally as well as the DiBenedetto fit in the Kinetics Neo software.
This fit was obtained with the following parameters:
Tg0 = -35.8°C
Tg∞ = 125.7°C
λ = 0.40

Kinetic Analysis and Kinetic Model
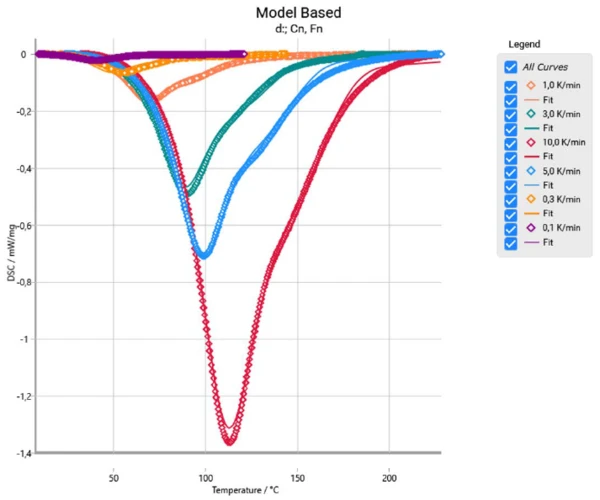
A second set of tests used varying heating rates (0.1 to 10 K/min) to study reaction kinetics. For this, new mixtures were prepared, weighed, and immediately measured (samples 6 to 11).
Figure 4 shows the measured experimental data (points) along with the curves (solid) calculated with the kinetics parameters optimized in the NETZSCH Kinetics Neo software, based on six DSC measurements at different heating rates of 0.1 to 10 K min−1. A model with two successive steps was selected to characterize the reaction kinetics because the shoulder detected in the ExothermicA sample transition or a reaction is exothermic if heat is generated.exothermal curing peak along with the peak minimum indicated a 2-step reaction.
This model included an autocatalysis reaction for the first step (simplified Kamal-Sourour equation) and an nth order reaction for the second step. Additionally, diffusion control above the glass transition temperature (see DiBenedetto results from TM-DSC tests) was considered for the second step. A non-linear regression was performed to optimize the kinetics parameters (pre-exponential factors, activation energy and reaction order); see table 2.
Table 2: Kinetics parameters results
| Parameter | 1st step | 2nd step |
| Activation energy (kJ/mol) | 51.1 | 54.8 |
| Log (PreExp) (1/s) | 4.3 | 4.7 |
| ReactOrder n | 1.7 | 1 |
| Contribution | 0.7 | 0.3 |
Determination of the Gel Point
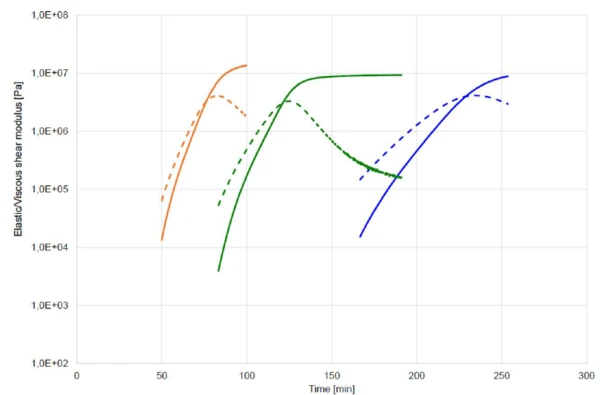
Rheological tests for gel point determination were conducted using a NETZSCH Kinexus Prime rheometer: For that, IsothermalTests at controlled and constant temperature are called isothermal.isothermal tests were performed from 40°C to 60°C with 0.1% StrainStrain describes a deformation of a material, which is loaded mechanically by an external force or stress. Rubber compounds show creep properties, if a static load is applied.strain at 1 Hz.
Figure 5 depicts the curves of the elastic (G') and viscous (G'') shear moduli during the three IsothermalTests at controlled and constant temperature are called isothermal.isothermal measurements at 40°C, 50°C and 60°C. They show a crossover of G´ and G´ indicating the gel point, above which the material is no longer able to flow for the frequency applied. The higher the temperature, the faster the reaction and the lower the time elapsed up to gel point.
Table 3 presents a summary of the results. The cure degree achieved at each temperature was determined using the gel point time from the conversion curve as a function of temperature or time predicted by the kinetics analysis.
Table 3: Gel point time obtained for the different IsothermalTests at controlled and constant temperature are called isothermal.isothermal tests
Temperature [°C] | Gel point time [min] | [%] |
| 40 | 224.8 | 63 |
| 50 | 117.3 | 53 |
| 60 | 72.1 | 66 |
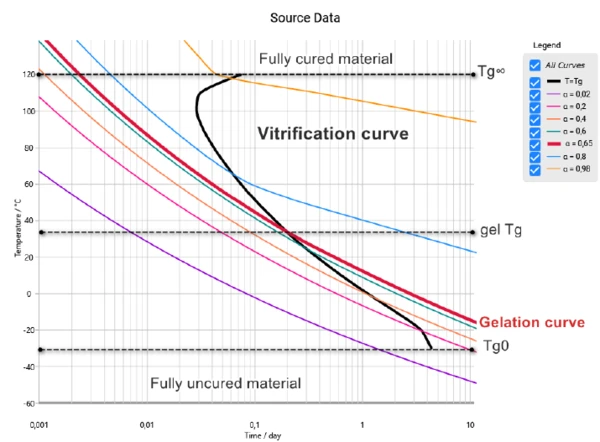
Construction of Time-Temperature-Transformation (TTT) Diagram
The NETZSCH Kinetics Neo software was used for kinetics analysis and TTT diagram simulation.
The TTT diagram in figure 6 illustrates the material’s cure state under IsothermalTests at controlled and constant temperature are called isothermal.isothermal conditions. Below -36.8°C, the monomers remain glassy, with a very slow curing rate, reaching 1% cure in at least 12 hours. Between -36.8°C (Tg0) and 126.1°C (Tg∞), curing behavior varies with temperature. If the temperature stays below Tg(gel) (crossing of the gelation and vitrification curves), vitrification occurs before gelation. Above Tg(gel), the material reaches the gel point before diffusion slows the reaction.
Conclusion
The use of Kinetics Neo software for calculating Time-Temperature-Transformation (TTT) diagrams offers a more advanced and predictive approach to analyzing the curing behavior. By leveraging kinetics analysis, it accurately identifies vitrification and gelation points, enabling precise control over material curing and more efficient process optimization.
Benefits of Kinetics Analysis
Reduced Costs & Waste: Optimized curing time lowers energy use and material waste, cutting costs and enhancing sustainability.
Accurate Cure Prediction: Provides precise modeling of the epoxy resin curing process, helping predict gelation and vitrification behavior under different temperature conditions.
Reduced Experimental Time: By using the NETZSCH DSC, rheological measurements and the Kinetics Neo software, this approach eliminates the need for long-term tests by avoiding trial-and-error experimentation while speeding up material development.