Introduction
Lithium-ion batteries (LIBs) are the backbone of modern portable electronics, electric vehicles, and grid storage systems [1]. Among the essential components of LIBs, the electrolyte plays a critical role in determining performance, safety, and lifespan. One of the most widely used lithium salts in commercial electrolytes is lithium hexafluorophosphate (LiPF6), primarily because of its good Ionic conductivity and compatibility with graphite anodes. However, LiPF6 is known to exhibit thermal and chemical instability, particularly under elevated temperatures.
The selection of solvents further complicates the stability profile of the electrolyte. Commonly used organic carbonate solvents ethylene carbonate (EC), dimethyl carbonate (DMC), and ethyl methyl carbonate (EMC) each contribute differently to the thermal behavior and Decomposition reactionA decomposition reaction is a thermally induced reaction of a chemical compound forming solid and/or gaseous products. decomposition pathways of the electrolyte system.
Therefore, a detailed understanding of the kinetic and Thermal StabilityA material is thermally stable if it does not decompose under the influence of temperature. One way to determine the thermal stability of a substance is to use a TGA (thermogravimetric analyzer). thermal stability of LiPF6 in these solvent environments is crucial for improving battery safety. This study aims to investigate the Thermal StabilityA material is thermally stable if it does not decompose under the influence of temperature. One way to determine the thermal stability of a substance is to use a TGA (thermogravimetric analyzer). thermal stability and conduct a kinetic analysis of LiPF6 in a single mixed carbonate solvent system (EMC+DMC+EC in a 1:1:1 ratio), using Differential Scanning Calorimetry (DSC) and the Kinetics Neo software, and to assess the Thermal StabilityA material is thermally stable if it does not decompose under the influence of temperature. One way to determine the thermal stability of a substance is to use a TGA (thermogravimetric analyzer). thermal stability, determine kinetic parameters, and perform prediction through simulation under different conditions. Such investigations are essential for improving the safety of lithium-ion batteries.
Measurement Conditions
DSC measurements were performed using a NETZSCH DSC under the measurement conditions listed in table 1. The DSC curves obtained are the basis for kinetic evaluation.
Table 1:
| Instrument | NETZSCH DSC |
|---|---|
| Crucible | Closed gold-plated, high-pressure-stable stainless-steel container, volume 27 μl |
| Sample mass | 11.3 - 11.9 mg |
| Temperature range | 30 - 500°C |
| Atmosphere | N2 |
| Heating rates | 1, 2 and 5 K/min |
Measurement Results and Discussion
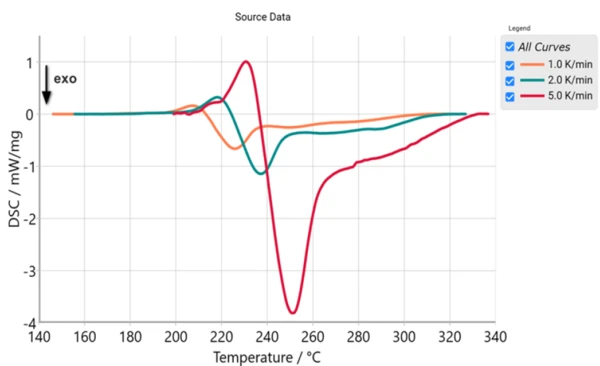
Figure 1 depicts the DSC curves of 1 M LiPF6/ EMC+DMC+EC in a 1:1:1 ratio electrolyte at different heating rates of 1, 2 and 5 K/min.
LiPF6/EMC+DMC+EC electrolyte reveals multiple thermal events above 190°C. At a heating rate of 5 K/min:
- an endothermal peak is observed at about 230°C,
- an ExothermicA sample transition or a reaction is exothermic if heat is generated.exothermal peak appears at about 250°C,
- a broader, less intense ExothermicA sample transition or a reaction is exothermic if heat is generated.exothermal peak emerges at about 290°C.
As the heating rate increases (1, 2, and 5 K/min), the DSC peaks shift to higher temperatures, accompanied by broader and less distinct peaks at higher heating rates (kinetic influence) [5].
Kinetic Analysis
Understanding the reaction kinetics of LiPF6/EMC+DMC+EC electrolyte is essential for improving the safety of lithium-ion batteries. Thermal analysis reveals, at a heating rate of 5 K/min, an endothermal peak at about 230°C, attributed to the Decomposition reactionA decomposition reaction is a thermally induced reaction of a chemical compound forming solid and/or gaseous products. decomposition of LiPF6 and solvent-specific interactions, particularly in the LiPF6/DEC electrolyte system [2]. Following this, an ExothermicA sample transition or a reaction is exothermic if heat is generated.exothermal peak appears at about 250°C, associated with the interaction between LiPF6 and EC, where LiPF6 may act as a Lewis acid by accepting electron pairs, promoting ring cleavage and forming Decomposition reactionA decomposition reaction is a thermally induced reaction of a chemical compound forming solid and/or gaseous products. decomposition products [2,3]. At higher temperatures, a broader and less intense ExothermicA sample transition or a reaction is exothermic if heat is generated.exothermal peak is observed at about 290°C, which is possibly due to polymerization reactions that produce polyethylene oxide (PEO)-like polymers and release CO2 [2,4].
The dependence of endothermal and ExothermicA sample transition or a reaction is exothermic if heat is generated.exothermal peaks on the heating rate allows for kinetic evaluation using the NETZSCH Kinetics Neo software.
Figure 2 shows the measurement of DSC curves as well as the curves calculated using the three-step kinetics model by using the NETZSCH Kinetics Neo software.
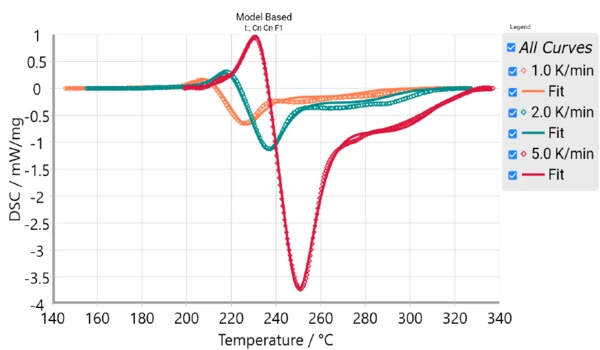
Table 2 summarizes the kinetic parameters. The results demonstrate strong agreement between the measured and calculated data with a coefficient of determination of 0.997.
Table 2: Kinetic parameters of LiPF6/EMC+DMC+EC electrolyte DSC measurement
| Reaction step | A→B | B→C | C→D |
| Reaction type | Cn | Cn | F1 |
| Activation energy [kJ/mol] | 146.3 | 137.2 | 118.6 |
| Log (pre-exponential factor) [Log (1/s)] | 12.3 | 10.9 | 8.6 |
| Reaction order | 0.89 | 1.94 | 1 |
| Log (Autocat pre-exponential factor [Log(1/s)] | 1.18 | 1.24 | - |
| Contribution | -0.17 | 0.79 | 0.36 |
| Coefficient of determination (R²) | 0.997 |
Cn: Reaction of nth order with autocatalysis
F1 : Reaction of 1st order
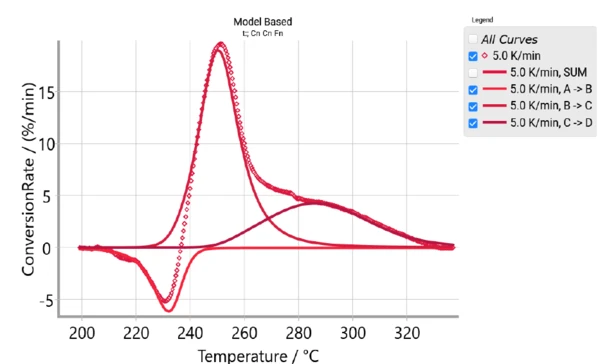
The degree of conversion, α, is calculated by the Kinetics Neo software from the DSC measurement, where α ranges from 0 to 1 (see equation 1). In thermal analysis, the conversion is operationally defined as the thermoanalytical effect observed at temperature T (or at time t for IsothermalTests at controlled and constant temperature are called isothermal.isothermal measurements) divided by the total thermoanalytical effect. Specifically, for DSC, the observed thermoanalytical effect is heat consumption/evolution, so the definition of thermoanalytical conversion is as follows:
where ΔH (T) is the partial area of the DSC peak up to temperature T, and ΔH (total) is the total area of the peak corresponding, to the complete enthalpy change of the reaction.
This suggests a multi-step reaction process, which can be modeled with a three-step kinetic model.
The reaction rate of each step j [5], is described by the function (eq. 2):

Aj: pre-exponential factor
Ej: activation energy [J/mol]
T: temperature [K]
R: gas constant (8.314 J/K.mol)
f (ej, pj): function dependent on the concentration of the initial reactant, ej, and the concentration of product, pj
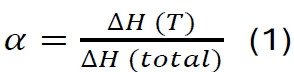
For the DSC measurement on the LiPF6/EMC+DMC+EC electrolyte, we observe three thermal events corresponding to the conversion rate peaks at about 230, 250 and 290°C as shown in figure 3, where the conversion rate (at 5 K/min) is defined as the first derivative of conversion with respect to time.
Isothermal Prediciton Based on Non-Isothermal Kinetic Analysis
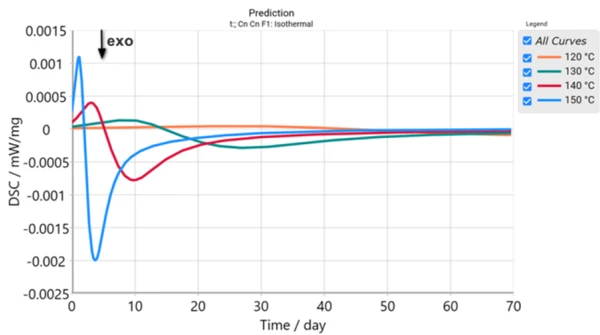
Based on the determined kinetics model, the Kinetics Neo software calculates the behavior of the LiPF6/EMC+DMC+EC electrolyte at any time/temperature.
Using the Kinetics Neo software, we can predict the reaction behavior of the LiPF6/EMC+DMC+EC electrolyte at various temperatures. Figure 4 presents the LiPF6/EMC+DMC+EC electrolyte’s DSC signal under different IsothermalTests at controlled and constant temperature are called isothermal.isothermal conditions. At higher temperatures (150°C), sharp endothermal peaks appear rapidly (after around 1 day). As the temperature decreases to 140°C and 130°C, endothermal peaks appear at 3 days for 140°C and at 9 days for 130°C. At 120°C, a broader and less intense endothermal peak emerges after extended durations (~24 days). Figure 4 shows the prediction of the signal of the LiPF6/EMC+DMC+EC electrolyte at 120°C, 130°C, 140°C and 150°C.
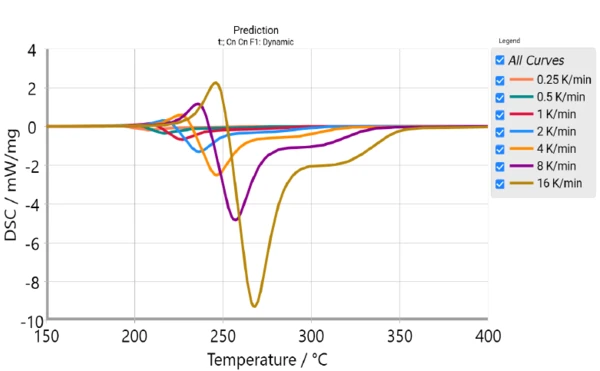
Prediction at Different Heating Rates Using Non-Isothermal Kinecis Analysis
Figure 5 shows the prediction of DSC signals for LiPF6 in an EC+DMC+EMC solvent at various heating rates as a function of temperature. This prediction clarifies the effect of the heating rate on electrolyte stability. Kinetics Neo software also enables predictions based on IsothermalTests at controlled and constant temperature are called isothermal.isothermal kinetic analysis.
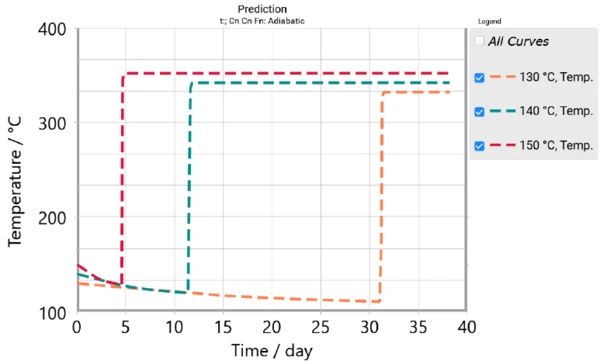
Adiabatic Prediction Based on Non-Isothermal Kinetic Analysis
Figure 6 shows that the LiPF6/EMC+DMC+EC electrolyte is predicted to undergo Thermal runawayA thermal runaway is the situation where a chemical reactor is out of control with respect to temperature and/or pressure production caused by the chemical reaction itself. Simulation of a thermal runaway is usually carried out using a calorimeter device according to accelerated rate calorimetry (ARC®).thermal runaway after approximately 4.5 days at 150°C, 11.5 days at 140°C, and 31.2 days at 130°C under AdiabaticAdiabatic describes a system or measurement mode without any heat exchange with the surroundings. This mode can be realized using a calorimeter device according to the method of accelerating rate calorimetry (ARC®). The main purpose of such a device is to study scenarios and thermal runaway reactions. A short description of the adiabatic mode is “no heat in – no heat out”.adiabatic conditions. The initial decrease in the temperature curve is attributed to an endothermal reaction step. For the electrolyte, a median literature value of 1650 J kg-¹ K-¹ was adopted for its Specific Heat Capacity (cp)Heat capacity is a material-specific physical quantity, determined by the amount of heat supplied to specimen, divided by the resulting temperature increase. The specific heat capacity is related to a unit mass of the specimen.specific heat capacity and the contribution of LiPF6 was neglected, given its low mass fraction in the mixture [6]. The system was considered with an enthalpy of 333.65 J g-¹ and a temperature change (ΔT) of 202.2 K.
Conclusion
The combination of the NETZSCH DSC and the Kinetics Neo software has proven effective in determining the kinetic parameters of LiPF6-based electrolytes and predicting thermal behavior through simulation at various temperatures, heating rates and AdiabaticAdiabatic describes a system or measurement mode without any heat exchange with the surroundings. This mode can be realized using a calorimeter device according to the method of accelerating rate calorimetry (ARC®). The main purpose of such a device is to study scenarios and thermal runaway reactions. A short description of the adiabatic mode is “no heat in – no heat out”.adiabatic conditions. Such investigations are critical for ensuring the safety of lithium-ion batteries.